Disparities In Stem Employment By Sex, Race, And Hispanic Origin - American Community Survey Reports (U.s. Census Bureau) Page 5
ADVERTISEMENT
 Printable pdf") 1
1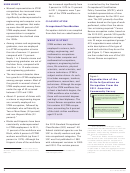 2
2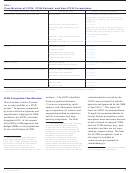 3
3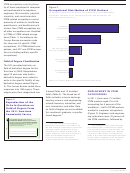 4
4 5
5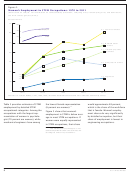 6
6 7
7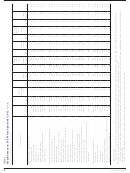 8
8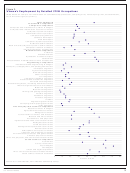 9
9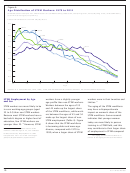 10
10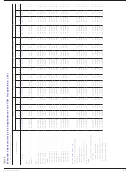 11
11 12
12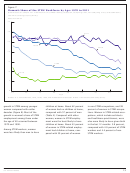 13
13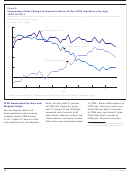 14
14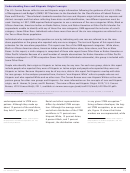 15
15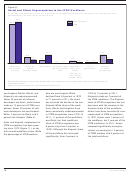 16
16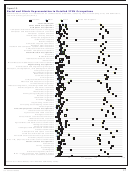 17
17 18
18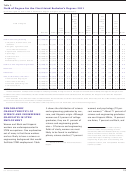 19
19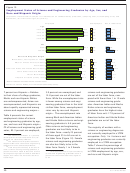 20
20 21
21 22
22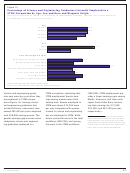 23
23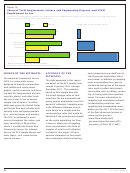 24
24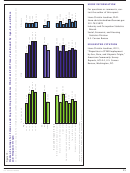 25
25Table 2.
Field of Bachelor’s Degree Classification
Broad fields
Detailed fields
Science and engineering
Computers, mathematics, and statistics
Biological, agricultural, and environmental sciences
Physical and related science
Psychology
Social sciences
Engineering
Multidisciplinary studies
Science- and engineering-related
Science- and engineering-related (e.g., nursing, architecture, mathematics teacher education)
Business
Business (e.g., business management, accounting)
Education
Education (e.g., elementary education, general education)
Arts, humanities, and other
Literature and languages
Liberal arts and history
Visual and performing arts
Communications
Other (e.g., criminal justice, social work)
life and physical scientists (12 per-
workers, and 17 percent of social
science awarded since the 1980s.
16
cent), social scientists (4 percent),
scientists (Figure 4).
Women’s underrepresentation in
15
and workers employed in math-
STEM is a result of their significant
By 2011, women’s representation
ematical occupations (3 percent).
underrepresentation in engineering
had grown in all STEM occupation
and computer occupations, rather
groups. However, they remained
Men and Women in STEM
than math and science occupations.
significantly underrepresented in
Occupations
While women’s representation has
engineering and computer occupa-
continued to grow in math and sci-
Although women make up nearly
tions, occupations that make up
ence occupations since the 1970s,
half of the working population,
more than 80 percent of all STEM
growth has tapered off in engineer-
they remain underrepresented in
employment (Table 3). In fact,
ing since 1990. In 2011, women
STEM occupations. In 2011, 26
women’s representation in com-
were 13 percent of engineers, 27
percent of STEM workers were
puter occupations has declined
percent of computer professionals,
women and 74 percent were men.
since the 1990s. This mirrors
41 percent of life and physical sci-
There has been uneven growth in
the decline in women’s share of
entists, 47 percent of mathematical
women’s representation in STEM
bachelor’s degrees in computer
workers, and 61 percent of social
occupations since the 1970s. In
scientists.
1970, women were 3 percent of
Estimates for 1970, 1980, 1990, and
15
engineers, 14 percent of life and
2000 in this report were obtained using inter-
National Science Foundation, Division of
16
physical scientists, 15 percent
nal Census Bureau files. Estimates may differ
Science Resources Statistics, 2011, “Women,
from those published previously because of
Minorities, and Persons with Disabilities
of mathematical and computer
specific age restrictions (25 to 64) used in
in Science and Engineering: 2011,” Special
this report.
Report NSF 11-309, Arlington, VA.
5
U.S. Census Bureau
ADVERTISEMENT
0 votes
Related Articles
Related forms

 Survey Methodology #2012-02 - New Relationship And Marital Questions: A Reflection Of Changes To The Social And Legal Recognition Of Same-sex Couples In The U.s. - U.s. Census Bureau
Legal
Survey Methodology #2012-02 - New Relationship And Marital Questions: A Reflection Of Changes To The Social And Legal Recognition Of Same-sex Couples In The U.s. - U.s. Census Bureau
Legal
 Survey Methodology #2006-02 - Use Of Dependent Interviewing Procedures To Improve Data Quality In The Measurement Of Change - U.s. Census Bureau
Legal
Survey Methodology #2006-02 - Use Of Dependent Interviewing Procedures To Improve Data Quality In The Measurement Of Change - U.s. Census Bureau
Legal

 - Consolidated Bas - U.s. Census Bureau")


 En Espanol: Using Cognitive Interviews To Test The Functional Equivalency Of Questionnaire Translations - U.s. Bureau Of The Census")


Related Categories
Parent category: Legal