Disparities In Stem Employment By Sex, Race, And Hispanic Origin - American Community Survey Reports (U.s. Census Bureau) Page 19
ADVERTISEMENT
 Printable pdf") 1
1 2
2 3
3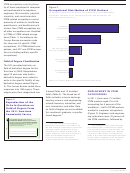 4
4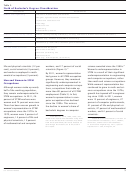 5
5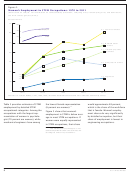 6
6 7
7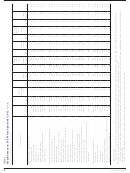 8
8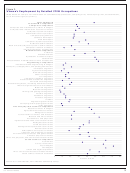 9
9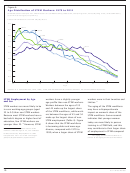 10
10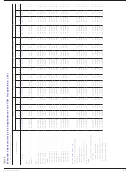 11
11 12
12 13
13 14
14 15
15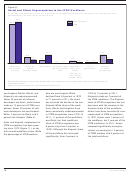 16
16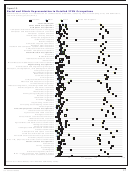 17
17 18
18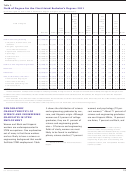 19
19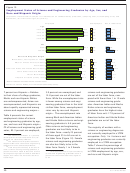 20
20 21
21 22
22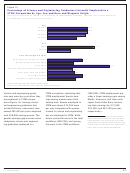 23
23 24
24 25
25Table 5.
Field of Degree for the First Listed Bachelor’s Degree: 2011
(Civilians aged 25 to 64 with a bachelor’s degree or higher level of education)
Per-
cent
Per-
White
cent
alone,
Black
Per-
Field of degree
not
or
cent
His-
Per-
African
His-
Per-
panic
cent
Ameri-
panic
cent
or
Asian
can
or
Number
MOE
female MOE
Latino MOE
alone MOE
alone MOE
Latino MOE
1
1
1
1
1
1
Total . . . . . . . . . . . . . . . . . . . . . 49,543,828 161,133
52 .9
0 .1
74 .1
0 .1
9 .4
0 .1
7 .9
0 .1
6 .9
0 .1
Science and engineering . . . . . . . . . 17,335,550
85,430
41 .3
0 .2
70 .7
0 .2
13 .5
0 .1
7 .1
0 .1
6 .8
0 .1
Computers, mathematics, and
statistics . . . . . . . . . . . . . . . . . . . . .
2,213,820
25,361
33.9
0.5
63.9
0.5
19.8
0.5
8.6
0.4
5.8
0.3
Biological, agricultural, and
environmental sciences . . . . . . . . .
3,163,602
32,126
45.4
0.5
74.9
0.5
11.9
0.3
5.7
0.3
5.5
0.2
Physical and related science . . . . . .
1,604,216
26,143
37.5
0.7
70.5
0.7
15.5
0.5
6.5
0.4
6.0
0.4
Psychology . . . . . . . . . . . . . . . . . . . .
2,429,801
25,241
69.5
0.6
75.5
0.5
5.7
0.3
9.2
0.3
7.7
0.3
Social sciences . . . . . . . . . . . . . . . .
3,904,676
39,907
47.6
0.4
73.8
0.4
8.4
0.2
8.6
0.3
7.2
0.2
Engineering . . . . . . . . . . . . . . . . . . .
3,703,261
35,023
16.3
0.3
64.7
0.4
21.2
0.4
4.5
0.2
7.9
0.3
Multidisciplinary science studies . . .
316,174
10,618
71.1
1.6
73.2
1.3
8.8
1.0
8.0
0.9
7.3
0.7
Science- and engineering-related . .
4,520,818
40,101
71 .3
0 .3
71 .7
0 .3
11 .7
0 .3
8 .5
0 .3
6 .4
0 .2
Business . . . . . . . . . . . . . . . . . . . . . . . 10,579,589
61,058
45 .8
0 .2
72 .8
0 .2
8 .6
0 .1
9 .4
0 .2
7 .7
0 .2
Education . . . . . . . . . . . . . . . . . . . . . .
5,857,864
43,523
77 .2
0 .2
81 .5
0 .3
3 .1
0 .1
7 .4
0 .2
6 .6
0 .2
Arts, humanities, and other . . . . . . . 11,250,007
64,610
57 .4
0 .2
77 .6
0 .2
6 .0
0 .1
7 .8
0 .2
6 .8
0 .1
Literature and languages . . . . . . . . .
2,075,751
25,872
67.8
0.5
78.9
0.5
8.0
0.3
5.2
0.3
6.1
0.3
Liberal arts and history . . . . . . . . . .
2,382,628
25,009
42.9
0.5
79.8
0.5
5.8
0.2
6.5
0.3
6.2
0.3
Visual and performing arts . . . . . . . .
2,068,872
29,156
60.9
0.6
78.9
0.5
8.1
0.3
4.7
0.3
6.3
0.3
Communications . . . . . . . . . . . . . . .
2,020,494
26,209
59.1
0.6
78.7
0.6
4.3
0.3
8.4
0.4
6.9
0.3
Other . . . . . . . . . . . . . . . . . . . . . . . .
2,702,262
27,301
58.3
0.6
73.0
0.5
4.3
0.2
12.7
0.4
8.2
0.3
Data are based on a sample and are subject to sampling variability. A margin of error is a measure of an estimate’s variability. The larger the margin of error
1
in relation to the size of the estimates, the less reliable the estimate. When added to and subtracted from the estimate, the margin of error forms the 90 percent
confidence interval.
Note: Estimates for the American Indian and Alaska Native, Native Hawaiian and Other Pacific Islander, Some Other Race, and Two or More Races populations
are not shown because of a small number of sample observations.
Source: U.S. Census Bureau, 2011 American Community Survey. For more information, see <www.acs.census.gov/acs>.
DEMOGRAPHIC
5 shows the distribution of science
women) and psychology (70 per-
CHARACTERISTICS OF
and engineering graduates by sex,
cent women).
About 71 percent of
27
SCIENCE AND ENGINEERING
race, and Hispanic origin. Although
science and engineering graduates
GRADUATES IN STEM
women are 53 percent of college
are non-Hispanic White, 14 percent
EMPLOYMENT
graduates, they are 41 percent of
are Asian, 7 percent are Black, and
science and engineering gradu-
Women and Black and Hispanic
ates.
Of science and engineering
26
workers are underrepresented in
The estimates for multidisciplinary
27
fields of study, women are most
science studies and psychology are not
STEM occupations. One explanation
statistically different. Multidisciplinary science
likely to be found in multidisci-
out of many is that these workers
studies includes sciences that are not else-
plinary science studies (71 percent
where classified, such as nutrition sciences,
are less likely to have a science or
combined majors including a science and
engineering background that would
engineering major, such as accounting and
Based on first listed field of bachelor’s
computer science, and nonspecified multidis-
26
facilitate STEM employment. Table
degree.
ciplinary studies.
19
U.S. Census Bureau
ADVERTISEMENT
0 votes
Related Articles
Related forms

 Survey Methodology #2012-02 - New Relationship And Marital Questions: A Reflection Of Changes To The Social And Legal Recognition Of Same-sex Couples In The U.s. - U.s. Census Bureau
Legal
Survey Methodology #2012-02 - New Relationship And Marital Questions: A Reflection Of Changes To The Social And Legal Recognition Of Same-sex Couples In The U.s. - U.s. Census Bureau
Legal
 Survey Methodology #2006-02 - Use Of Dependent Interviewing Procedures To Improve Data Quality In The Measurement Of Change - U.s. Census Bureau
Legal
Survey Methodology #2006-02 - Use Of Dependent Interviewing Procedures To Improve Data Quality In The Measurement Of Change - U.s. Census Bureau
Legal

 - Consolidated Bas - U.s. Census Bureau")


 En Espanol: Using Cognitive Interviews To Test The Functional Equivalency Of Questionnaire Translations - U.s. Bureau Of The Census")


Related Categories
Parent category: Legal