Employee Satisfaction Survey Page 10
ADVERTISEMENT
 1
1 2
2 3
3 4
4 5
5 6
6 7
7 8
8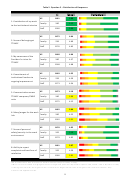 9
9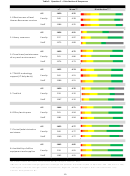 10
10 11
11 12
12 13
13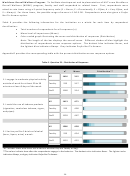 14
14 15
15 16
16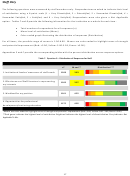 17
17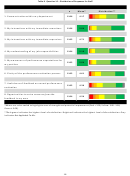 18
18 19
19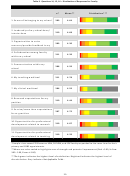 20
20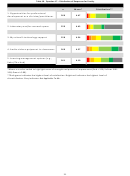 21
21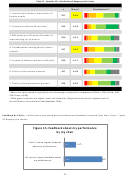 22
22 23
23 24
24 25
25 26
26 27
27 28
28 29
29 30
30 31
31 32
32 33
33 34
34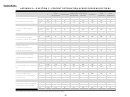 35
35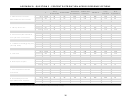 36
36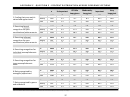 37
37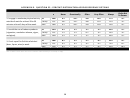 38
38 39
39 40
40 41
41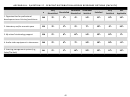 42
42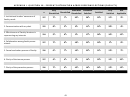 43
43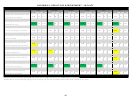 44
44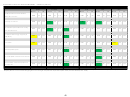 45
45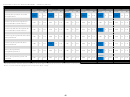 46
46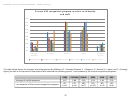 47
47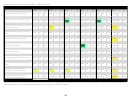 48
48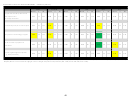 49
49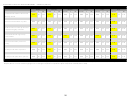 50
50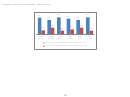 51
51 52
52 53
53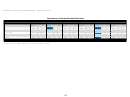 54
54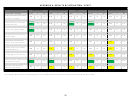 55
55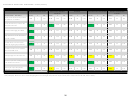 56
56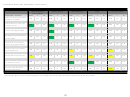 57
57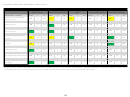 58
58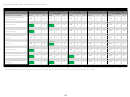 59
59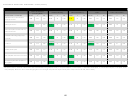 60
60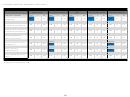 61
61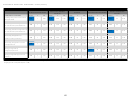 62
62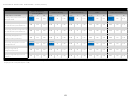 63
63 64
64 65
65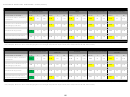 66
66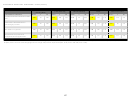 67
67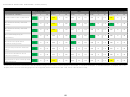 68
68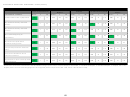 69
69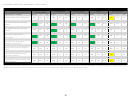 70
70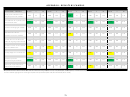 71
71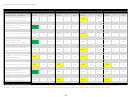 72
72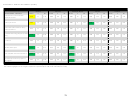 73
73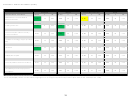 74
74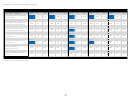 75
75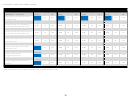 76
76 77
77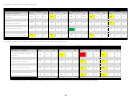 78
78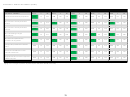 79
79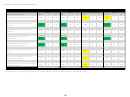 80
80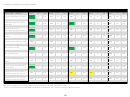 81
81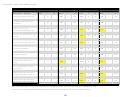 82
82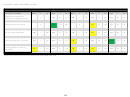 83
83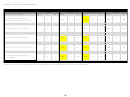 84
84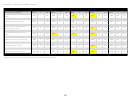 85
85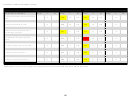 86
86 87
87 88
88 89
89Table 3. Question 5 – Distribution of Responses
n*
Mean**
Distribution***
All
1450
4.25
1. Effectiveness of local
Faculty
260
4.28
Human Resources services
Staff
1186
4.25
All
1436
4.91
2. Library resources
Faculty
257
4.97
Staff
1175
4.89
All
1439
4.75
3. Cleanliness/maintenance
Faculty
261
4.86
of my work environment
Staff
1174
4.73
All
1452
4.74
4. TTUHSC technology
Faculty
262
4.51
support (IT Help desk)
Staff
1186
4.51
All
1430
4.76
5. Techlink
Faculty
259
4.32
Staff
1167
4.32
All
1446
4.71
6. Office/work space
Faculty
261
4.94
Staff
1181
4.94
All
1433
4.77
7. Clerical/administrative
Faculty
260
4.77
assistance
Staff
1169
4.77
All
1445
4.85
8. Availability of office
Faculty
259
4.91
equipment and supplies
Staff
1182
4.91
*All i ncl udes thos e who chos e not to decl a re whether they a re Faculty or Staff .
**Mea ns a re col or‐coded to hi ghl i ght a rea s of s trength a nd potenti a l i mprovement (Red < 3.00, Yel l ow: 3.00 ‐ 3.99, Green ≥ 5.00).
***Da rk green i ndi ca tes the hi ghes t l evel of s a ti s fa cti on. Bri ght red i ndi ca tes the hi ghes t l evel of di s s a ti s fa cti on. Gra y
i ndi ca tes Not Applicable To Me .
10
ADVERTISEMENT
0 votes
Related Articles
Related forms


Related Categories
Parent category: Life