Employee Satisfaction Survey Page 19
ADVERTISEMENT
 1
1 2
2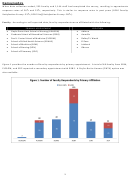 3
3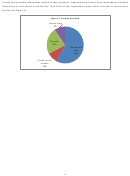 4
4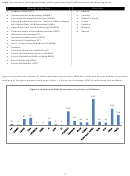 5
5 6
6 7
7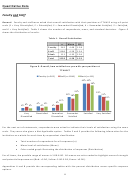 8
8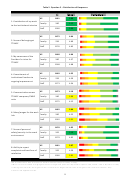 9
9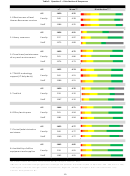 10
10 11
11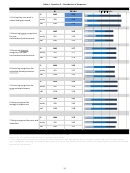 12
12 13
13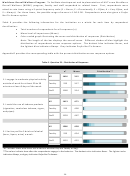 14
14 15
15 16
16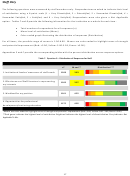 17
17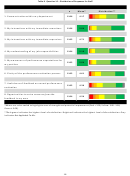 18
18 19
19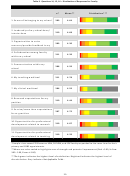 20
20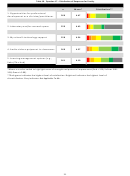 21
21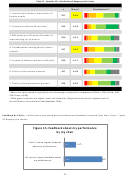 22
22 23
23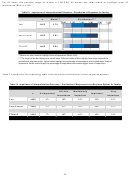 24
24 25
25 26
26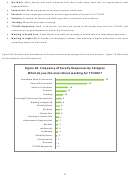 27
27 28
28 29
29 30
30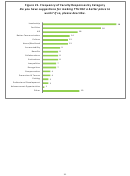 31
31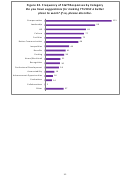 32
32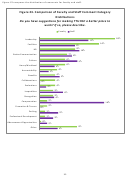 33
33 34
34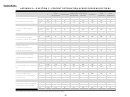 35
35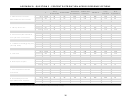 36
36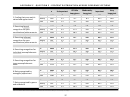 37
37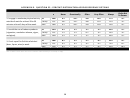 38
38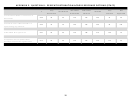 39
39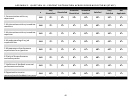 40
40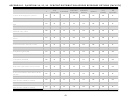 41
41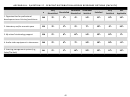 42
42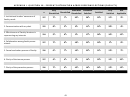 43
43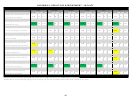 44
44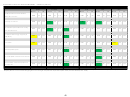 45
45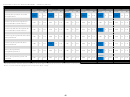 46
46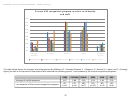 47
47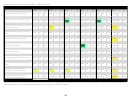 48
48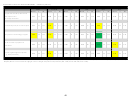 49
49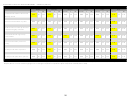 50
50 51
51 52
52 53
53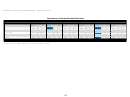 54
54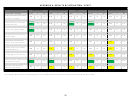 55
55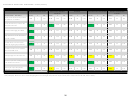 56
56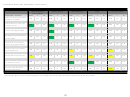 57
57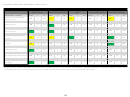 58
58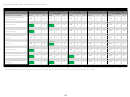 59
59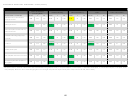 60
60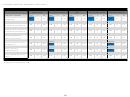 61
61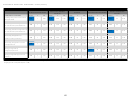 62
62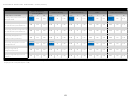 63
63 64
64 65
65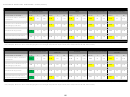 66
66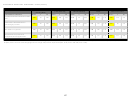 67
67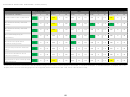 68
68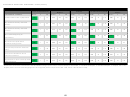 69
69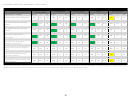 70
70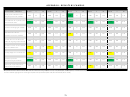 71
71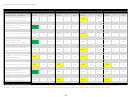 72
72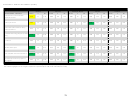 73
73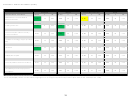 74
74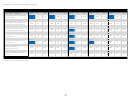 75
75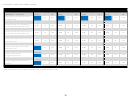 76
76 77
77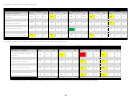 78
78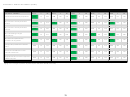 79
79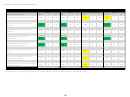 80
80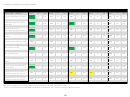 81
81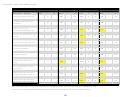 82
82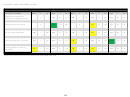 83
83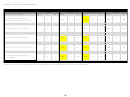 84
84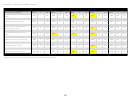 85
85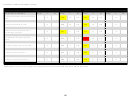 86
86 87
87 88
88 89
89Faculty Only
General. The following questions were answered by faculty only. Respondents were asked to indicate their
levels of satisfaction using a 6-point scale (1 = Very Dissatisfied, 2 = Dissatisfied, 3 = Somewhat Dissatisfied, 4 =
Somewhat Satisfied, 5 = Satisfied, and 6 = Very Satisfied). Respondents were also given a Not Applicable
option. Tables 9 through 11 provide the following information for the institution as a whole for each item:
Total number of respondents for all responses (n)
Mean level of satisfaction (Mean)
Color-coded graph illustrating the distribution of responses (Distribution)
For all items, the possible range of means is 1.00-6.00. Means are color-coded to highlight areas of strength
and potential improvement (Red: <3.00, Yellow: 3.00-3.99, Green: ≥5.00).
Appendices G through I show the corresponding tables with the percent distribution across response options.
19
ADVERTISEMENT
0 votes
Related Articles
Related forms


Related Categories
Parent category: Life