Employee Satisfaction Survey Page 24
ADVERTISEMENT
 1
1 2
2 3
3 4
4 5
5 6
6 7
7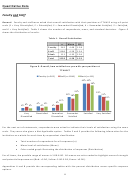 8
8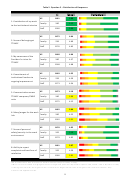 9
9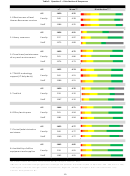 10
10 11
11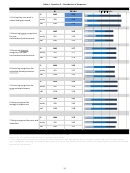 12
12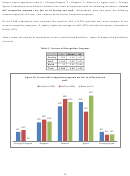 13
13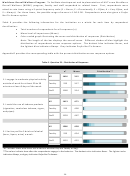 14
14 15
15 16
16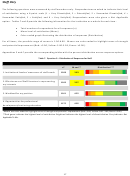 17
17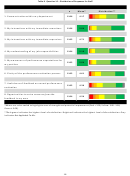 18
18 19
19 20
20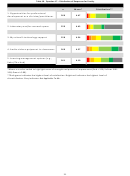 21
21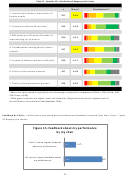 22
22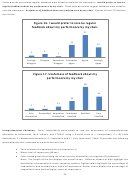 23
23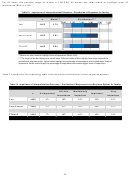 24
24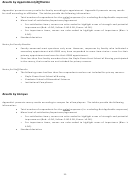 25
25 26
26 27
27 28
28 29
29 30
30 31
31 32
32 33
33 34
34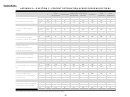 35
35 36
36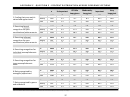 37
37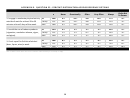 38
38 39
39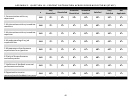 40
40 41
41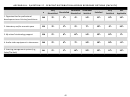 42
42 43
43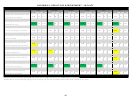 44
44 45
45 46
46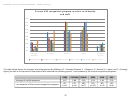 47
47 48
48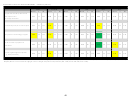 49
49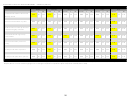 50
50 51
51 52
52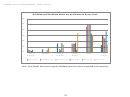 53
53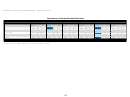 54
54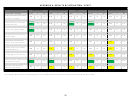 55
55 56
56 57
57 58
58 59
59 60
60 61
61 62
62 63
63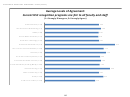 64
64 65
65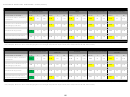 66
66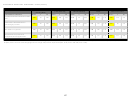 67
67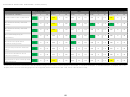 68
68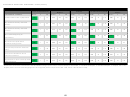 69
69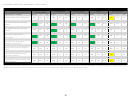 70
70 71
71 72
72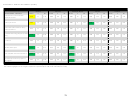 73
73 74
74 75
75 76
76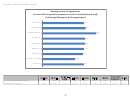 77
77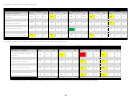 78
78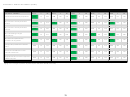 79
79 80
80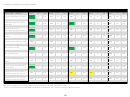 81
81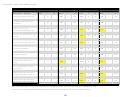 82
82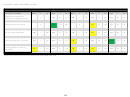 83
83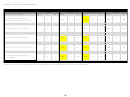 84
84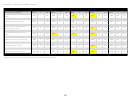 85
85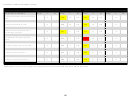 86
86 87
87 88
88 89
89For all items, the possible range of means is 1.00-5.00. All means are color-coded to highlight areas of
importance (Blue: ≥ 4.00).
Table 12. Importance of Interprofessional Education – Distribution of Responses for Faculty
n
Mean**
Distribution***
You
1465
3.79
Your School
1462
3.81
TTUHSC
1463
3.95
**Means are color‐coded to highlight areas of importance (Blue ≥ 4.00).
***The length of the bar displays the overall mean. Different shades of blue highlight how many respondents
marked each response option. Lighter colors highlight the percentage of respondents who marked lower levels of
importance. Darker colors display the percentage of respondents who marked higher levels of importance.
Table 13 shows the corresponding table with the percent distribution across response options.
Table 13. Importance of Interprofessional Education – Distribution of Responses Across Response Options for Faculty
Of Little
Moderately
Very
n
Unimportant
Important
Importance
Important
Important
You
1465
4%
10%
22%
35%
31%
Your School
1462
2%
8%
20%
44%
25%
TTUHSC
1463
1%
10%
16%
40%
33%
24
ADVERTISEMENT
0 votes
Related Articles
Related forms


Related Categories
Parent category: Life