Employee Satisfaction Survey Page 14
ADVERTISEMENT
 1
1 2
2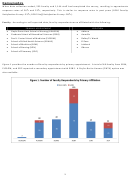 3
3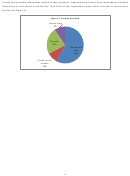 4
4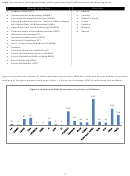 5
5 6
6 7
7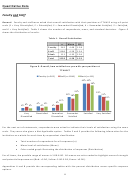 8
8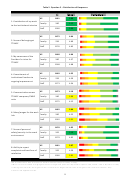 9
9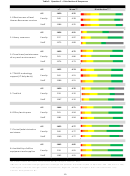 10
10 11
11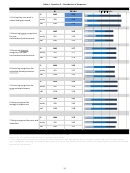 12
12 13
13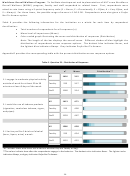 14
14 15
15 16
16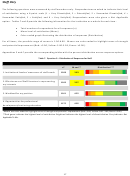 17
17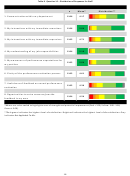 18
18 19
19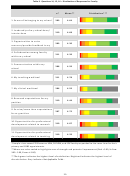 20
20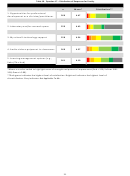 21
21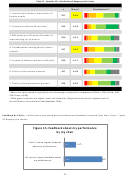 22
22 23
23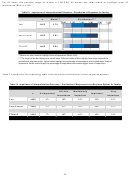 24
24 25
25 26
26 27
27 28
28 29
29 30
30 31
31 32
32 33
33 34
34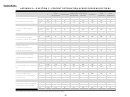 35
35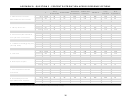 36
36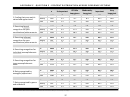 37
37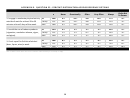 38
38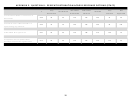 39
39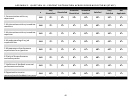 40
40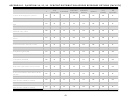 41
41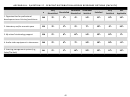 42
42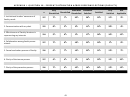 43
43 44
44 45
45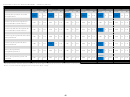 46
46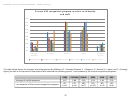 47
47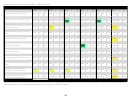 48
48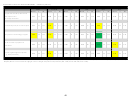 49
49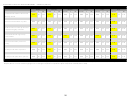 50
50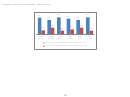 51
51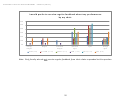 52
52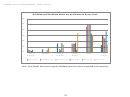 53
53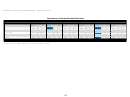 54
54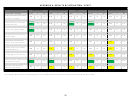 55
55 56
56 57
57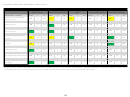 58
58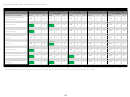 59
59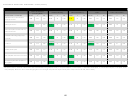 60
60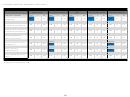 61
61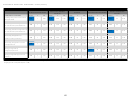 62
62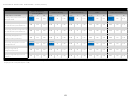 63
63 64
64 65
65 66
66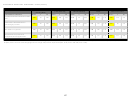 67
67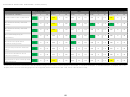 68
68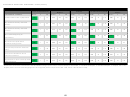 69
69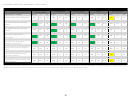 70
70 71
71 72
72 73
73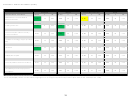 74
74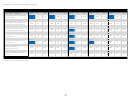 75
75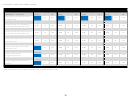 76
76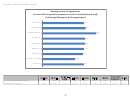 77
77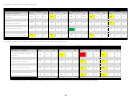 78
78 79
79 80
80 81
81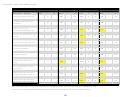 82
82 83
83 84
84 85
85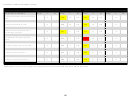 86
86 87
87 88
88 89
89Workforce Overall Wellness Program. To facilitate development and implementation of HSC’s new Workforce
Overall Wellness (WOW!) program, faculty and staff responded to related items. First, respondents were
asked to rate items using a 5-point frequency scale (1 = Never, 2 = Occasionally, 3 = Often, 4 = Very Often, and
5 = Always). For these items, the possible range of means is 1.00-5.00. Respondents were also given a Prefer
Not To Answer option.
Table 6 provides the following information for the institution as a whole for each item by respondent
classification:
Total number of respondents for all responses (n)
Mean level of importance (Mean)
Color-coded graph illustrating the mean and distribution of responses (Distribution)
Note: The length of the bar displays the overall mean. Different shades of blue highlight the
distribution of respondents across response options. The darkest blue indicates Never, and
the lightest blue indicates Always. Gray indicates Prefer Not To Answer.
Appendix D provides the corresponding table with the percent distribution across response options.
Table 6. Question 23 – Distribution of Responses
n*
Mean
Distribution**
All
1416
3.15
1. I engage in moderate physical activity
outside of work for at least 20 to 30
Faculty
255
3.17
minutes at least 5 days of the week.
Staff
1160
3.14
All
1413
4.71
2. I avoid the use of tobacco products
(cigarettes, smokeless tobacco, cigars,
Faculty
253
4.90
and pipes).
Staff
1159
4.67
All
1386
4.28
3. I limit myself to 5 drinks of alcohol
Faculty
253
4.54
(beer, liquor, wine) a week.
Staff
1132
4.22
*All i ncl udes thos e who chos e not to decl a re whether they a re Faculty or Staff .
**The col ors i ndi ca te how often the res pondents enga ge i n the beha vi or. The da rkes t col or i ndi ca tes Never. The l i ghtes t col or
i ndi ca tes Always , a nd gra y i ndi ca tes Prefer Not To Answer .
14
ADVERTISEMENT
0 votes
Related Articles
Related forms


Related Categories
Parent category: Life