Employee Satisfaction Survey Page 36
ADVERTISEMENT
 1
1 2
2 3
3 4
4 5
5 6
6 7
7 8
8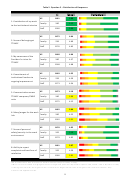 9
9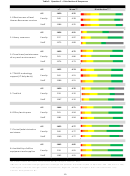 10
10 11
11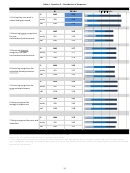 12
12 13
13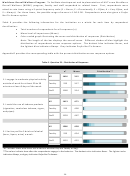 14
14 15
15 16
16 17
17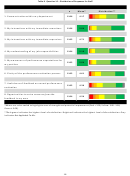 18
18 19
19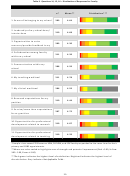 20
20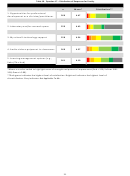 21
21 22
22 23
23 24
24 25
25 26
26 27
27 28
28 29
29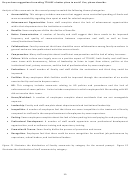 30
30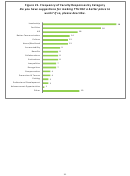 31
31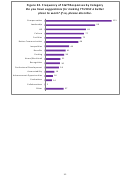 32
32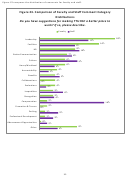 33
33 34
34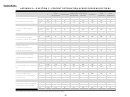 35
35 36
36 37
37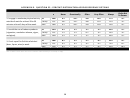 38
38 39
39 40
40 41
41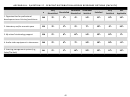 42
42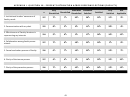 43
43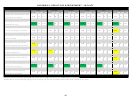 44
44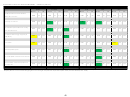 45
45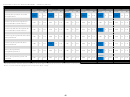 46
46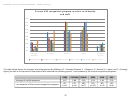 47
47 48
48 49
49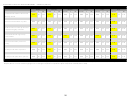 50
50 51
51 52
52 53
53 54
54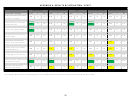 55
55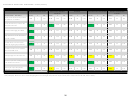 56
56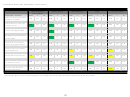 57
57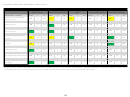 58
58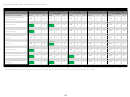 59
59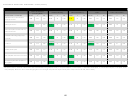 60
60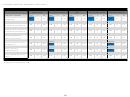 61
61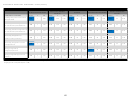 62
62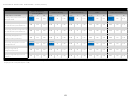 63
63 64
64 65
65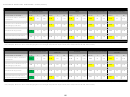 66
66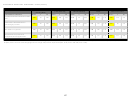 67
67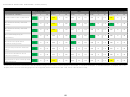 68
68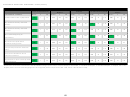 69
69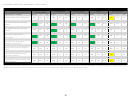 70
70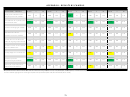 71
71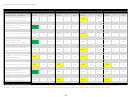 72
72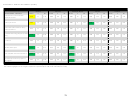 73
73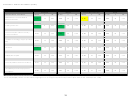 74
74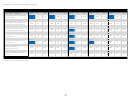 75
75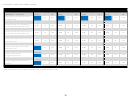 76
76 77
77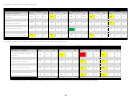 78
78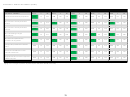 79
79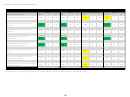 80
80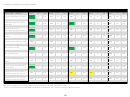 81
81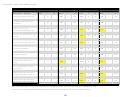 82
82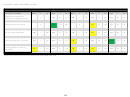 83
83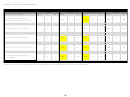 84
84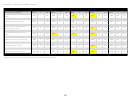 85
85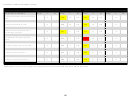 86
86 87
87 88
88 89
89APPENDIX B. QUESTION 5 - PERCENT DISTRIBUTION ACROSS RESPONSE OPTIONS
Very
Somewhat
Somewhat
Very
Not
n
Dissatisfied
Satisfied
Dissatisfied
Dissatisfied
Satisfied
Satisfied
Applicable
All
1450
7%
6%
10%
20%
39%
14%
4%
1. Effectiveness of local
Faculty
260
5%
6%
12%
20%
37%
13%
8%
Human Resources services
Staff
1186
7%
6%
9%
20%
39%
15%
3%
All
1436
1%
1%
3%
8%
37%
15%
35%
2. Library resources
Faculty
257
1%
2%
6%
13%
40%
33%
4%
Staff
1175
1%
1%
2%
7%
37%
11%
42%
All
1439
2%
3%
8%
16%
46%
24%
1%
3. Cleanliness/maintenance
Faculty
261
2%
3%
8%
13%
44%
30%
1%
of my work environment
Staff
1174
2%
4%
7%
16%
46%
23%
1%
All
1452
2%
4%
7%
19%
41%
26%
2%
4. TTUHSC technology support
Faculty
262
5%
6%
9%
19%
32%
28%
1%
(IT Help desk)
Staff
1186
1%
3%
6%
19%
43%
26%
2%
All
1430
1%
2%
4%
13%
42%
14%
23%
5. Techlink
Faculty
259
2%
7%
10%
19%
29%
12%
22%
Staff
1167
1%
1%
3%
12%
45%
15%
23%
All
1446
3%
4%
7%
16%
44%
24%
2%
6. Office/work space
Faculty
261
2%
2%
6%
15%
41%
33%
2%
Staff
1181
3%
4%
8%
16%
45%
23%
1%
All
1433
3%
3%
6%
15%
41%
25%
8%
7. Clerical/administrative
Faculty
260
3%
5%
8%
14%
30%
38%
1%
assistance
Staff
1169
2%
3%
5%
15%
43%
22%
10%
All
1445
2%
3%
6%
13%
45%
29%
1%
8. Availability of office
Faculty
259
2%
3%
7%
15%
37%
35%
2%
equipment and supplies
Staff
1182
3%
3%
6%
13%
47%
28%
1%
*All i ncl udes thos e who chos e not to decl a re wether they a re Faculty or Staff .
36
ADVERTISEMENT
0 votes
Related Articles
Related forms


Related Categories
Parent category: Life