Employee Satisfaction Survey Page 56
ADVERTISEMENT
 1
1 2
2 3
3 4
4 5
5 6
6 7
7 8
8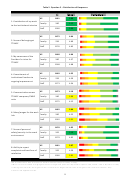 9
9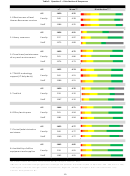 10
10 11
11 12
12 13
13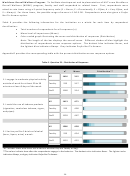 14
14 15
15 16
16 17
17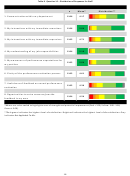 18
18 19
19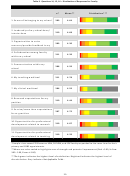 20
20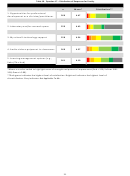 21
21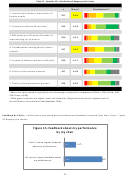 22
22 23
23 24
24 25
25 26
26 27
27 28
28 29
29 30
30 31
31 32
32 33
33 34
34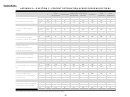 35
35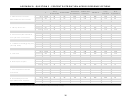 36
36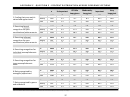 37
37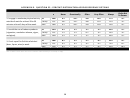 38
38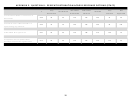 39
39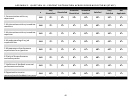 40
40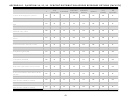 41
41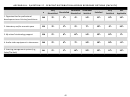 42
42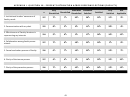 43
43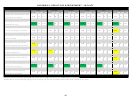 44
44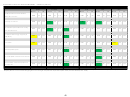 45
45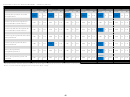 46
46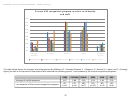 47
47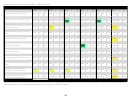 48
48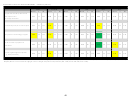 49
49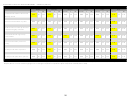 50
50 51
51 52
52 53
53 54
54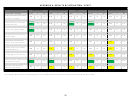 55
55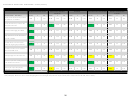 56
56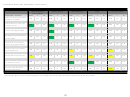 57
57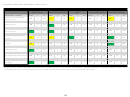 58
58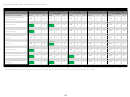 59
59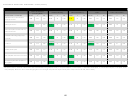 60
60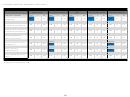 61
61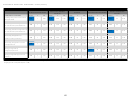 62
62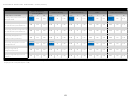 63
63 64
64 65
65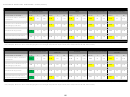 66
66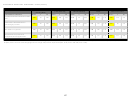 67
67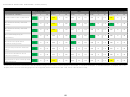 68
68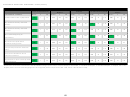 69
69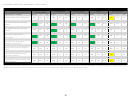 70
70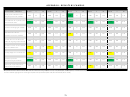 71
71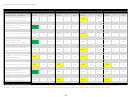 72
72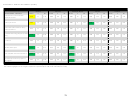 73
73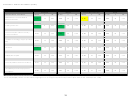 74
74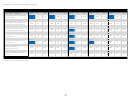 75
75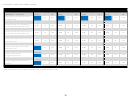 76
76 77
77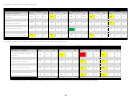 78
78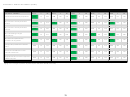 79
79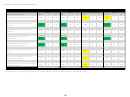 80
80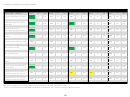 81
81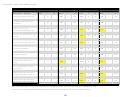 82
82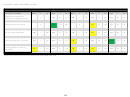 83
83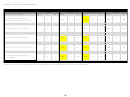 84
84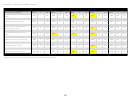 85
85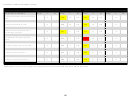 86
86 87
87 88
88 89
89APPENDIX K. RESULTS BY AFFILIATION – STAFF (CONT.)
Paul L. Foster School of
School of Allied Health
Institutional Advancement
Research
Rural and Community Health
Medicine
Sciences
SATISFACTION I - SECTION 2
Mean*
n
SD
Mean*
n
SD
Mean*
n
SD
Mean*
n
SD
Mean*
n
SD
Overall, how satisfied are you with
4.71
7
1.70
4.39
160
1.32
4.46
50
1.53
4.23
30
1.25
4.71
34
.80
your position at TTUHSC?
1. Contribution of my work to the
5.86
7
.38
5.12
158
1.05
4.88
49
1.18
5.14
28
.59
4.97
34
.83
institutional mission
2. Sense of belonging at TTUHSC
5.71
7
.49
4.79
157
1.21
4.54
50
1.39
4.80
30
1.00
4.82
34
.94
3. My awareness of the President’s
5.71
7
.49
4.74
149
1.09
4.40
48
1.14
4.80
30
.89
4.63
32
1.13
vision for TTUHSC
4. Commitment of institutional
5.29
7
.76
4.43
153
1.22
4.39
49
1.30
4.73
30
1.11
4.55
33
1.06
leaders to ongoing improvement
5. Communication across TTUHSC
4.00
7
.82
4.29
153
1.21
4.21
47
1.23
4.52
27
1.01
4.06
33
1.22
campuses/CMHC units
6. Salary/wages for the work I do
4.71
7
.95
3.53
159
1.53
3.68
50
1.48
3.55
29
1.35
3.21
34
1.25
7. Sense of personal safety/security
5.50
6
.55
4.82
158
1.26
5.08
50
1.16
5.19
27
1.04
4.85
34
1.05
in the work environment
8. Ability to report complaints
5.43
7
.53
3.76
155
1.76
4.21
47
1.50
4.21
28
1.47
3.82
34
1.55
without fear of retaliation
*Respondents were asked to indicate their level of satisfaction using a 6-point scale ( 1 = Very Dissatisfied , 2 = Dissatisfied , 3 = Somewhat Dissatisfied , 4 = Somewhat Satisfied , 5 = Satisfied , and 6
= Very Satisfied ). Means are color‐coded to highlight areas of strength and potential improvement (Red: <3.00, Yellow: 3.00‐3.99, Green: ≥5.00).
56
ADVERTISEMENT
0 votes
Related Articles
Related forms


Related Categories
Parent category: Life