Employee Satisfaction Survey Page 45
ADVERTISEMENT
 1
1 2
2 3
3 4
4 5
5 6
6 7
7 8
8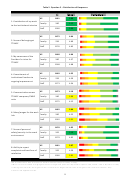 9
9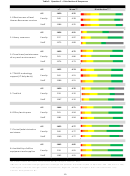 10
10 11
11 12
12 13
13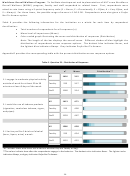 14
14 15
15 16
16 17
17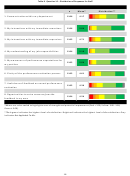 18
18 19
19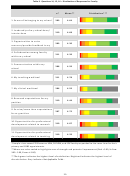 20
20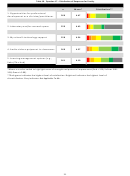 21
21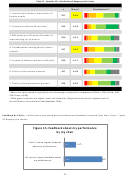 22
22 23
23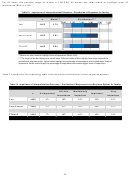 24
24 25
25 26
26 27
27 28
28 29
29 30
30 31
31 32
32 33
33 34
34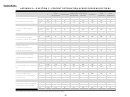 35
35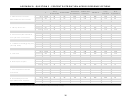 36
36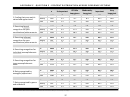 37
37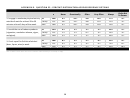 38
38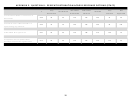 39
39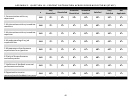 40
40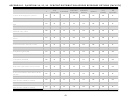 41
41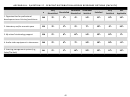 42
42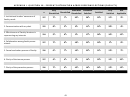 43
43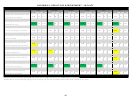 44
44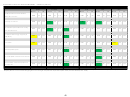 45
45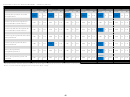 46
46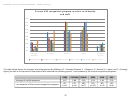 47
47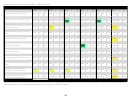 48
48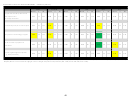 49
49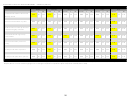 50
50 51
51 52
52 53
53 54
54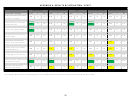 55
55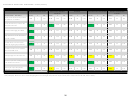 56
56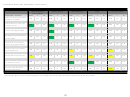 57
57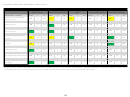 58
58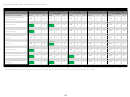 59
59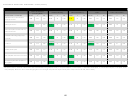 60
60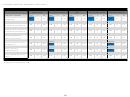 61
61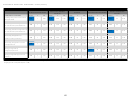 62
62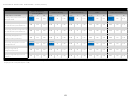 63
63 64
64 65
65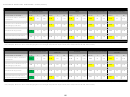 66
66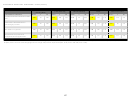 67
67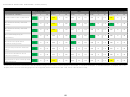 68
68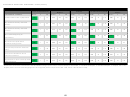 69
69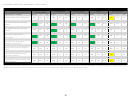 70
70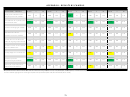 71
71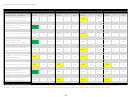 72
72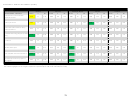 73
73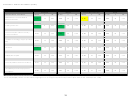 74
74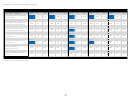 75
75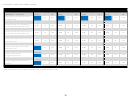 76
76 77
77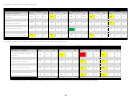 78
78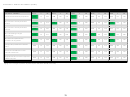 79
79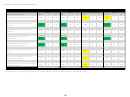 80
80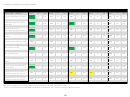 81
81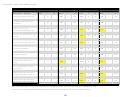 82
82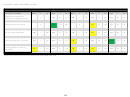 83
83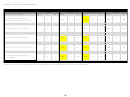 84
84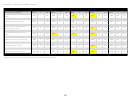 85
85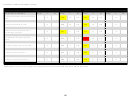 86
86 87
87 88
88 89
89APPENDIX J. RESULTS BY APPOINTMENT – FACULTY (CONT.)
GSBS
PLFSOM
SOAHS
SOM
SON
SOP
Mean*
n
SD
Mean
n
SD
Mean
n
SD
Mean
n
SD
Mean
n
SD
Mean
n
SD
1. Effectiveness of local Human
4.20
45
1.32
4.00
37
1.47
4.34
38
1.36
4.22
98
1.32
4.88
33
0.99
4.19
31
1.19
Resources services
2. Library resources
4.58
48
1.20
5.17
36
0.81
4.77
39
1.18
5.08
98
0.93
5.37
35
0.94
4.28
36
1.30
3. Cleanliness/maintenance of my
4.71
48
1.30
5.34
38
0.91
5.13
40
0.91
4.64
107
1.26
4.71
34
1.09
4.86
36
0.96
work environment
4. TTUHSC technology support (IT
3.86
49
1.51
4.03
38
1.46
5.05
40
1.11
4.42
106
1.38
4.78
37
1.58
4.31
36
1.41
Help desk)
5. Techlink
3.86
43
1.42
4.48
27
1.16
4.72
25
0.98
4.17
77
1.31
4.74
35
1.22
3.81
36
1.14
6. Office/work space
4.84
49
1.07
4.97
37
1.12
5.25
40
0.90
4.83
108
1.10
5.00
33
1.22
4.83
35
1.04
7. Clerical/administrative assistance
4.88
48
1.14
4.29
38
1.49
4.74
39
1.39
4.77
105
1.30
5.31
36
1.28
4.83
36
1.30
8. Availability of office equipment
4.76
46
1.18
4.92
38
1.10
5.26
39
0.91
4.69
106
1.19
5.26
35
1.07
4.76
34
1.23
and supplies
*Res pondents were a s ked to i ndi ca te thei r l evel of s a tis fa ction us i ng a 6-poi nt s ca l e ( 1 = Very Dissatisfied , 2 = Dissatisfied , 3 = Somewhat Dissatisfied , 4 = Somewhat Satisfied , 5 = Satisfied , a nd 6 = Very
Satisfied ). Mea ns a re col or‐coded to hi ghl i ght a rea s of s trength a nd potentia l i mprovement (Red: <3.00, Yel l ow: 3.00‐3.99, Green: ≥5.00).
45
ADVERTISEMENT
0 votes
Related Articles
Related forms


Related Categories
Parent category: Life