Employee Satisfaction Survey Page 8
ADVERTISEMENT
 1
1 2
2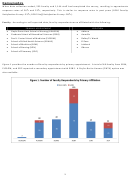 3
3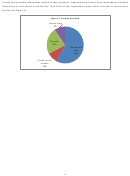 4
4 5
5 6
6 7
7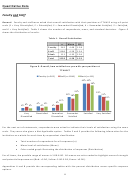 8
8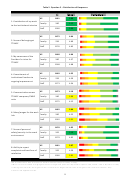 9
9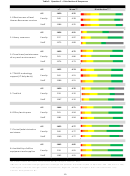 10
10 11
11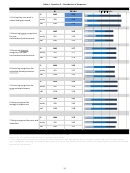 12
12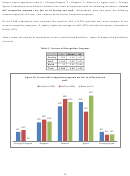 13
13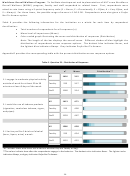 14
14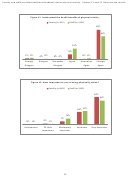 15
15 16
16 17
17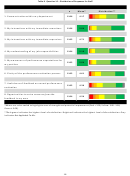 18
18 19
19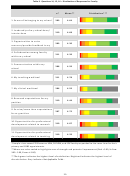 20
20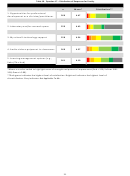 21
21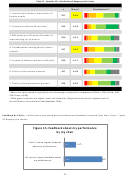 22
22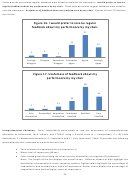 23
23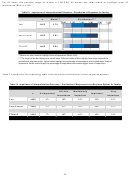 24
24 25
25 26
26 27
27 28
28 29
29 30
30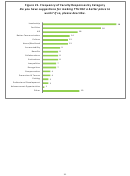 31
31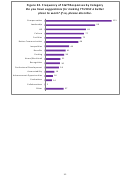 32
32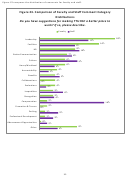 33
33 34
34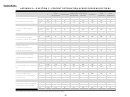 35
35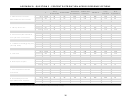 36
36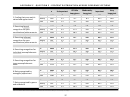 37
37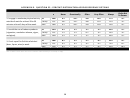 38
38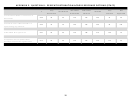 39
39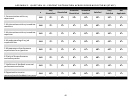 40
40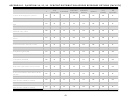 41
41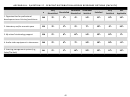 42
42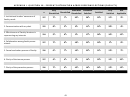 43
43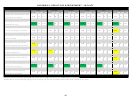 44
44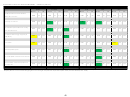 45
45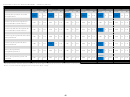 46
46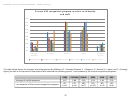 47
47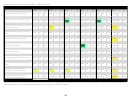 48
48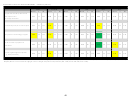 49
49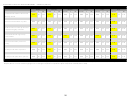 50
50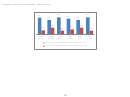 51
51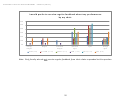 52
52 53
53 54
54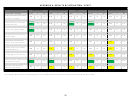 55
55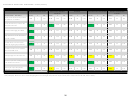 56
56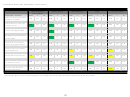 57
57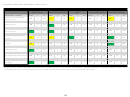 58
58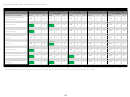 59
59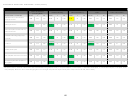 60
60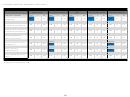 61
61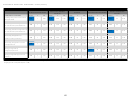 62
62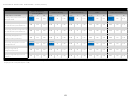 63
63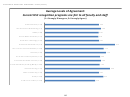 64
64 65
65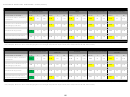 66
66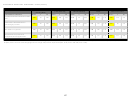 67
67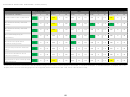 68
68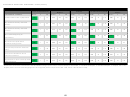 69
69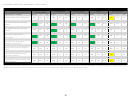 70
70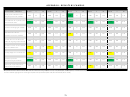 71
71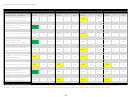 72
72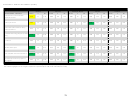 73
73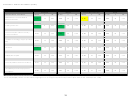 74
74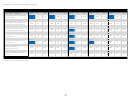 75
75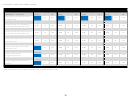 76
76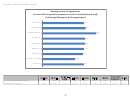 77
77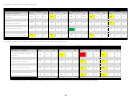 78
78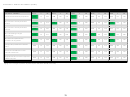 79
79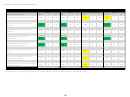 80
80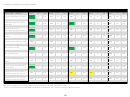 81
81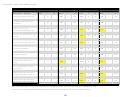 82
82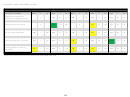 83
83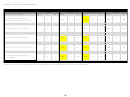 84
84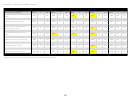 85
85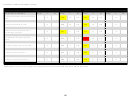 86
86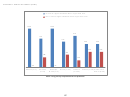 87
87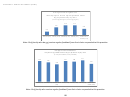 88
88 89
89Quantitative Data
Faculty and Staff
General. Faculty and staff were asked their overall satisfaction with their positions at TTUHSC using a 6-point
scale (1 = Very Dissatisfied, 2 = Dissatisfied, 3 = Somewhat Dissatisfied, 4 = Somewhat Satisfied, 5 = Satisfied,
and 6 = Very Satisfied). Table 1 shows the number of respondents, mean, and standard deviation. Figure 9
shows the distribution of results.
Table 1. Overall Satisfaction
n
Mean
SD
Faculty
262
4.60 1.28
Staff
1186
4.50 1.34
Blank
111
4.35 1.26
Total
1559
4.50 1.32
Figure 9. Overall, how satisfied are you with your position at
TTUHSC?
Faculty (n=262)
Staff (n=1186)
Blank (n=111)
42%
42%
39%
25%
23%
21%
21%
18%
15%
11%
9%
6%
6%
6%
4%
4%
4%
4%
Very
Dissatisfied
Somewhat
Somewhat
Satisfied
Very Satisfied
Dissatisfied
Dissatisfied
Satisfied
For the next set of statements, respondents were asked to indicate their levels of satisfaction using the same
scale. They were also given a Not Applicable option. Tables 2 and 3 provide the following information for the
institution as a whole for each item by respondent classification:
Total number of respondents for all responses (n)
Mean level of satisfaction (Mean)
Color-coded graph illustrating the distribution of responses (Distribution)
For all items, the possible range of means is 1.00-6.00. All means are color-coded to highlight areas of strength
and potential improvement (Red: <3.00, Yellow: 3.00-3.99, Green: ≥5.00).
Appendices A and B provide the corresponding tables with the percent distribution across specific response
options.
8
ADVERTISEMENT
0 votes
Related Articles
Related forms


Related Categories
Parent category: Life