16 Cumulative Frequency Worksheet Page 11
ADVERTISEMENT
 1
1 2
2 3
3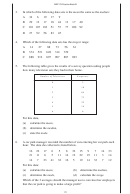 4
4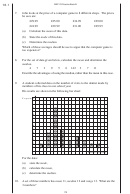 5
5 6
6 7
7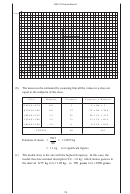 8
8 9
9 10
10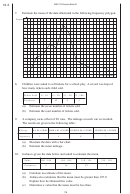 11
11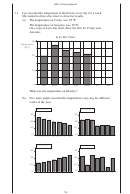 12
12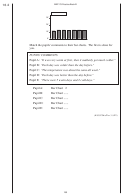 13
13 14
14 15
15 16
16 17
17 18
18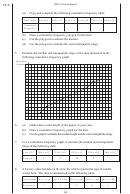 19
19 20
20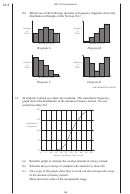 21
21 22
22 23
23 24
24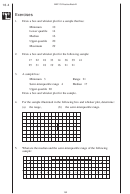 25
25 26
26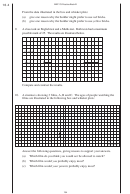 27
27MEP Y9 Practice Book B
16.2
7.
Estimate the mean of the data illustrated in the following frequency polygon:
Frequency
14
13
12
11
10
9
8
7
6
5
4
3
2
1
0
0
1
2
3
4
5
6
7
8
9
10
11
12
Time (seconds)
8.
Children were asked to sell tickets for a school play. A record was kept of
how many tickets each child sold.
Tickets Sold
0 - 10
11 - 20
21 - 50 51 - 100
Frequency
7
42
8
3
(a)
Estimate the mean number of tickets sold.
(b)
Estimate the total number of tickets sold.
9.
A company owns a fleet of 20 vans. The mileage on each van is recorded.
The results are given in the following table:
≤
<
≤
<
≤
<
≤
<
Mileage
0
M
5000
5000
M
10 000
10 000
M
15000
15000
M
20 000
Frequency
1
4
8
7
(a)
Illustrate the data with a bar chart.
(b)
Estimate the mean mileage.
10.
Joshua is given the data below and asked to estimate the mean.
Value
100 - 104
105 - 109
110 - 114
115 - 119
Frequency
5
16
32
7
(a)
Calculate an estimate of the mean.
(b)
Joshua also calculates that the mean must be greater than 107.9.
Explain how he obtained this value.
(c)
Determine a value that the mean must be less than.
178
ADVERTISEMENT
0 votes
Related Articles
Related forms

")


 - Cumulative Frequency")
")


Related Categories
Parent category: Education