16 Cumulative Frequency Worksheet Page 21
ADVERTISEMENT
 1
1 2
2 3
3 4
4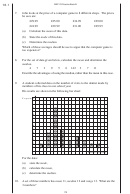 5
5 6
6 7
7 8
8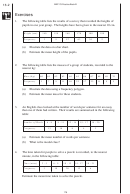 9
9 10
10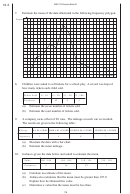 11
11 12
12 13
13 14
14 15
15 16
16 17
17 18
18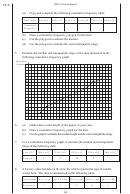 19
19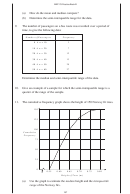 20
20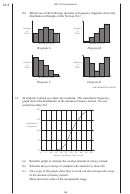 21
21 22
22 23
23 24
24 25
25 26
26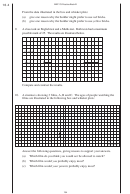 27
27MEP Y9 Practice Book B
16.3
(b)
Which one of the following sketches of frequency diagrams shows the
distribution of heights of the Norway firs?
Number
Number
of
of
Trees
Trees
Height of Trees
Height of Trees
Diagram A
Diagram B
Number
Number
of
of
Trees
Trees
Height of Trees
Height of Trees
Diagram C
Diagram D
(KS3/98/Ma/Tier 6-8/P2)
12.
40 students worked on a farm one weekend. The cumulative frequency
graph shows the distribution of the amount of money earned. No one
earned less than £15.
40
30
Cumulative
Frequency
20
10
0
0
5
10 15 20 25 30 35 40 45 50
Amount of Money Earned (£)
(a)
Read the graph to estimate the median amount of money earned.
(b)
Estimate the percentage of students who earned less than £40.
(c)
On a copy of the graph, show how to work out the interquartile range
of the amount of money earned.
Write down the value of the interquartile range.
188
ADVERTISEMENT
0 votes
Related Articles
Related forms

")


 - Cumulative Frequency")
")


Related Categories
Parent category: Education