16 Cumulative Frequency Worksheet Page 26
ADVERTISEMENT
 1
1 2
2 3
3 4
4 5
5 6
6 7
7 8
8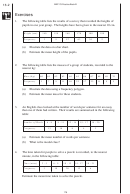 9
9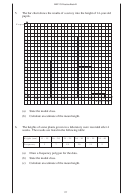 10
10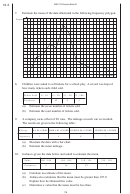 11
11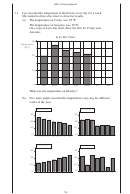 12
12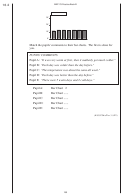 13
13 14
14 15
15 16
16 17
17 18
18 19
19 20
20 21
21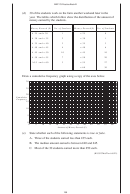 22
22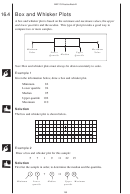 23
23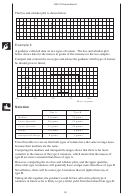 24
24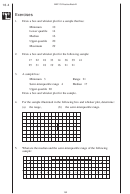 25
25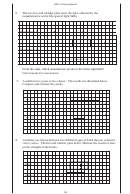 26
26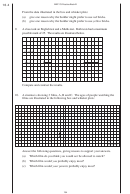 27
27MEP Y9 Practice Book B
6.
The two box and whisker plots show the data collected by the
manufacturers on the life-span of light bulbs.
Manufacturer A
Manufacturer B
0
1
2
3
4
5
6
7
8
Time (1000s hours)
From this data, which manufacturer produces the better light bulb?
Give reasons for your answer.
7.
A maths test is given to two classes. The results are illustrated below.
Compare and contrast the results.
Class 9P
Class 9Q
0
2
4
6
8
10
12
14
16
18
20
8.
A builder can choose between two different types of brick that are coloured
red or yellow. The box and whisker plots below illustrate the results of tests
on the strength of the bricks.
RED
YELLOW
193
ADVERTISEMENT
0 votes
Related Articles
Related forms

")


 - Cumulative Frequency")
")


Related Categories
Parent category: Education