16 Cumulative Frequency Worksheet Page 22
ADVERTISEMENT
 1
1 2
2 3
3 4
4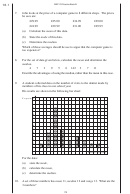 5
5 6
6 7
7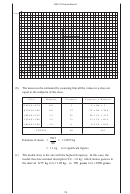 8
8 9
9 10
10 11
11 12
12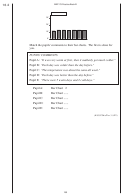 13
13 14
14 15
15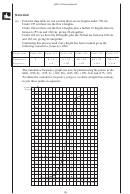 16
16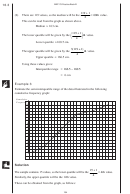 17
17 18
18 19
19 20
20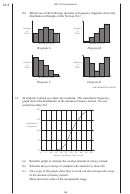 21
21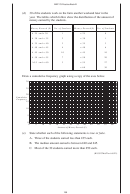 22
22 23
23 24
24 25
25 26
26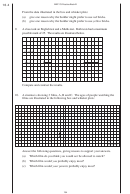 27
27MEP Y9 Practice Book B
(d)
30 of the students work on the farm another weekend later in the
year. The tables which follow show the distribution of the amount of
money earned by the students.
Money Earned (£) No. of Students
Money Earned(£)
No. of Students
≥
25 and< 30
1
< 25
0
≥
30 and < 35
2
< 30
1
≥
35 and < 40
3
< 35
3
≥
40 and < 45
4
< 40
6
≥
45 and < 50
10
< 45
10
≥
50 and < 55
7
< 50
20
≥
55 and < 60
3
< 55
27
< 60
30
Draw a cumulative frequency graph using a copy of the axes below.
30
25
20
Cumulative
Frequency
15
10
5
0
0
5
10
15
20
25
30
35
40
45
50
55
60
Amount of Money Earned (£)
(e)
State whether each of the following statements is true or false.
A. Three of the students earned less than £35 each.
B. The median amount earned is between £40 and £45.
C. Most of the 30 students earned more than £50 each.
(KS3/97/Ma/Tier 6-8/P1)
189
ADVERTISEMENT
0 votes
Related Articles
Related forms

")


 - Cumulative Frequency")
")


Related Categories
Parent category: Education