16 Cumulative Frequency Worksheet Page 24
ADVERTISEMENT
 1
1 2
2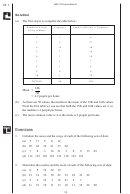 3
3 4
4 5
5 6
6 7
7 8
8 9
9 10
10 11
11 12
12 13
13 14
14 15
15 16
16 17
17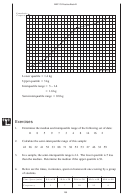 18
18 19
19 20
20 21
21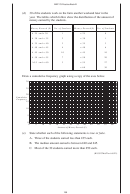 22
22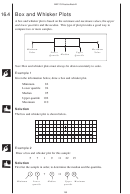 23
23 24
24 25
25 26
26 27
27MEP Y9 Practice Book B
The box and whisker plot is shown below:
0
2
4
6
8
10
12
14
16
18
20
22
24
Example 3
A gardener collected data on two types of tomato. The box and whisker plot
below shows data for the masses in grams of the tomatoes in the two samples.
Compare and contrast the two types and advise the gardener which type of tomato
he should grow in future.
Type A
Type B
40
45
50
55
60
Mass in grams
Solution
Type A
Type B
Median
52 grams
52 grams
Lower Quartile
49 grams
51 grams
Upper Quartile
57 grams
54 grams
Range
14 grams
8 grams
Interquartile Range
8 grams
3 grams
From this table we can see that both types of tomato have the same average mass
because their medians are the same.
Comparing the medians and interquartile ranges shows that there is far more
variation in the masses of the type A tomatoes, which means that the masses of
type B are more consistent than those of type A.
However, comparing the two box and whisker plots, and the upper quartiles,
shows that type A tomatoes will generally have a larger mass than those of type B.
Nevertheless, there will be some type A tomatoes that are lighter than any of
type B.
Taking all this together, the gardener would be best advised to plant type A
tomatoes in future as he is likely to get a better yield from them than from type B.
191
ADVERTISEMENT
0 votes
Related Articles
Related forms

")


 - Cumulative Frequency")
")


Related Categories
Parent category: Education