16 Cumulative Frequency Worksheet Page 15
ADVERTISEMENT
 1
1 2
2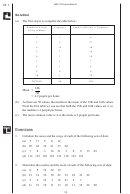 3
3 4
4 5
5 6
6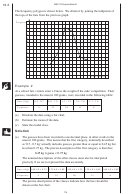 7
7 8
8 9
9 10
10 11
11 12
12 13
13 14
14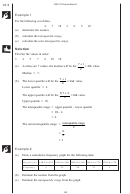 15
15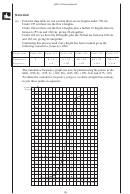 16
16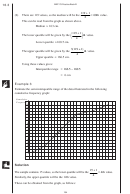 17
17 18
18 19
19 20
20 21
21 22
22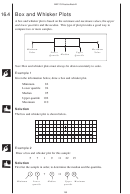 23
23 24
24 25
25 26
26 27
27MEP Y9 Practice Book B
16.3
Example 1
For the following set of data,
4
7
18
3
9
5
10
(a)
determine the median,
(b)
calculate the interquartile range,
(c)
calculate the semi-interquartile range.
Solution
First list the values in order:
3
4
5
7
9
10
18
+
7 1
= th
(a)
As there are 7 values, the median will be the
4
value.
2
=
Median
7.
+
7 1
= nd
(b)
The lower quartile will be the
2
value.
4
=
Lower quartile
4.
(
)
+
3 7 1
= th
The upper quartile will be the
6
value.
4
=
Upper quartile
10.
=
The interquartile range
upper quartile – lower quartile
= 10 4
−
=
6
interquartile range
=
The semi-interquartile range
2
6
=
2
=
3
Example 2
(a)
Draw a cumulative frequency graph for the following data:
≤ <
≤ <
≤ <
≤ <
≤ <
Height (cm)
150
h
155
155
h
160
160
h
165
165
h
170
170
h
175
Frequency
4
22
56
32
5
(b)
Estimate the median from the graph.
(c)
Estimate the interquartile range from the graph.
182
ADVERTISEMENT
0 votes
Related Articles
Related forms

")


 - Cumulative Frequency")
")


Related Categories
Parent category: Education