16 Cumulative Frequency Worksheet Page 19
ADVERTISEMENT
 1
1 2
2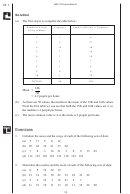 3
3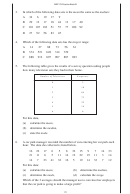 4
4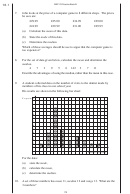 5
5 6
6 7
7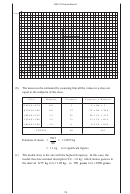 8
8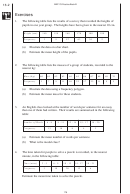 9
9 10
10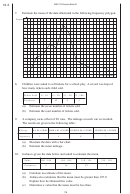 11
11 12
12 13
13 14
14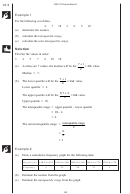 15
15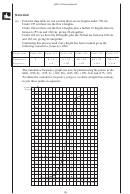 16
16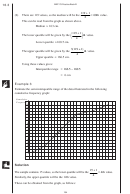 17
17 18
18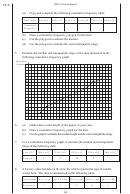 19
19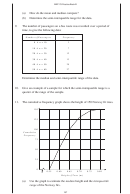 20
20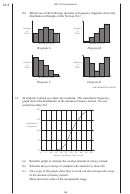 21
21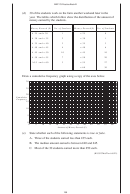 22
22 23
23 24
24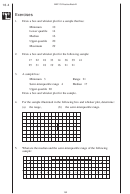 25
25 26
26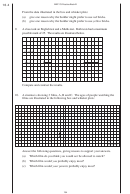 27
27MEP Y9 Practice Book B
16.3
(a)
Copy and complete the following cumulative frequency table:
Time (min)
Under 0
Under 10 Under 20 Under 30 Under 40 Under 50
Cumulative
Frequency
(b)
Draw a cumulative frequency polygon for this data.
(c)
Use the polygon to estimate the median.
(d)
Use the polygon to estimate the semi-interquartile range.
5.
Estimate the median and interquartile range of the data illustrated in the
following cumulative frequency graph:
Cumulative
Frequency
11
10
9
8
7
6
5
4
3
2
1
0
0
2
4
6
8
10
12
14
16
18
20
22
24
Height (cm)
6.
(a)
Gather data on the height of the pupils in your class.
(b)
Draw a cumulative frequency graph for the data.
(c)
Use the graph to estimate the median height and the semi-interquartile range.
7.
Use a cumulative frequency graph to estimate the median and interquartile
range of the following data:
≤ <
≤ <
≤ <
≤ <
≤ <
Cost (£)
10
c
11
11
c
12
12
c
13
13
c
14
14
c
15
Frequency
8
12
40
2
1
8.
A factory collected data on the time for which a particular type of candle
would burn. The data is summarised in the following table:
≤ <
≤ <
≤ <
≤ <
≤ <
Time
0
t
10
10
t
20
20
t
30
30
t
40
40
t
50
(mins)
Frequency
1
2
12
15
5
186
ADVERTISEMENT
0 votes
Related Articles
Related forms

")


 - Cumulative Frequency")
")


Related Categories
Parent category: Education