16 Cumulative Frequency Worksheet Page 25
ADVERTISEMENT
 1
1 2
2 3
3 4
4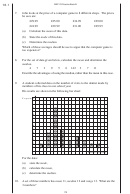 5
5 6
6 7
7 8
8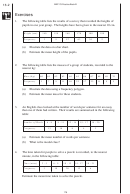 9
9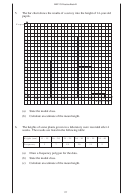 10
10 11
11 12
12 13
13 14
14 15
15 16
16 17
17 18
18 19
19 20
20 21
21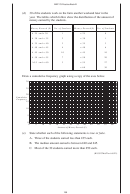 22
22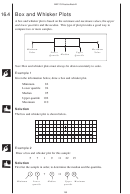 23
23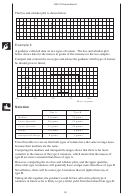 24
24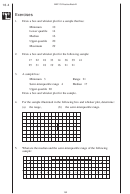 25
25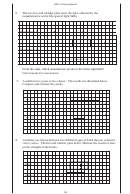 26
26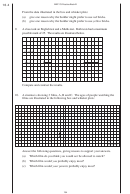 27
27MEP Y9 Practice Book B
16.4
Exercises
1.
Draw a box and whisker plot for a sample that has:
Minimum
10
Lower quartile
14
Median
16
Upper quartile
20
Maximum
29
2.
Draw a box and whisker plot for the following sample:
17
22
18
33
14
36
39
41
25
31
18
19
16
21
21
3.
A sample has:
Minimum 3
Range 21
Semi-interquartile range 4
Median 17
Upper quartile 20
Draw a box and whisker plot for the sample.
4.
For the sample illustrated in the following box and whisker plot, determine:
(a)
the range,
(b)
the semi-interquartile range.
0
4
8
12
16
20
24
28
36
40
44
48
52
56
60
5.
What are the median and the semi-interquartile range of the following
sample:
0
2
4
6
8
10
12
14
16
18
20
22
192
ADVERTISEMENT
0 votes
Related Articles
Related forms

")


 - Cumulative Frequency")
")


Related Categories
Parent category: Education