16 Cumulative Frequency Worksheet Page 14
ADVERTISEMENT
 1
1 2
2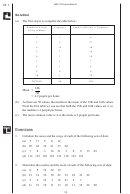 3
3 4
4 5
5 6
6 7
7 8
8 9
9 10
10 11
11 12
12 13
13 14
14 15
15 16
16 17
17 18
18 19
19 20
20 21
21 22
22 23
23 24
24 25
25 26
26 27
27MEP Y9 Practice Book B
16.3 Cumulative Frequency
Cumulative frequencies are easy to calculate from a frequency table. Cumulative
frequency graphs can then be used to estimate the median of a set of data. In this
section we also look at the idea of quartiles, the interquartile range and the semi-
interquartile range.
When you have a set of n values, in order,
n + 1
=
Lower quartile
th value
4
n + 1
=
Median
th value
2
(
)
n +
3
1
=
Upper quartile
th value
4
=
Interquartile range
upper quartile – lower quartile
interquartile range
=
Semi-interquartile range
2
If the data is arranged in an ordered list, and the number of data values, n, is odd
n + 1
then the
th value will be a single item from the list, and this will be the
2
+
95 1
n = 95
=
median. For example, if
the median will be the
48
th
value.
2
n + 1
However, if n is even then
will determine the two central values that must
2
+
156
1
n = 156
=
be averaged to obtain the median. For example, if
then
78 5
.
,
2
which tells us that we must average the 78th and 79th values to get the median.
For large sets of data, we estimate the lower quartile, median and upper quartile
n
n
3
n
n = 2000
using the
values. For example, if
, then we would
th,
th and
th
4
2
4
estimate the lower quartile, median and upper quartile using the 500th, 1000th and
1500th values.
181
ADVERTISEMENT
0 votes
Related Articles
Related forms

")


 - Cumulative Frequency")
")


Related Categories
Parent category: Education