16 Cumulative Frequency Worksheet Page 9
ADVERTISEMENT
 1
1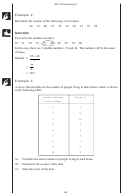 2
2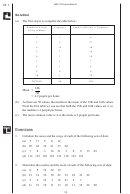 3
3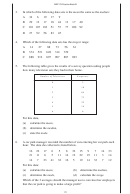 4
4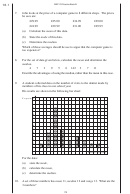 5
5 6
6 7
7 8
8 9
9 10
10 11
11 12
12 13
13 14
14 15
15 16
16 17
17 18
18 19
19 20
20 21
21 22
22 23
23 24
24 25
25 26
26 27
27MEP Y9 Practice Book B
16.2
Exercises
1.
The following table lists the results of a survey that recorded the heights of
pupils in one year group. The heights have been given to the nearest 10 cm.
Height (cm)
140
150
160
170
180
190
Frequency
3
5
57
63
30
2
(a)
Illustrate the data on a bar chart.
(b)
Estimate the mean height of the pupils.
2.
The following table lists the masses of a group of students, recorded to the
nearest kg:
Mass (kg)
60
61
62
63
64
65
66
67
68
69
70
Frequency
3
7
9
11
10
22
17
23
11
9
5
(a)
Illustrate the data using a frequency polygon.
(b)
Estimate the mean mass for these students.
3.
An English class looked at the number of words per sentence for an essay
that one of them had written. Their results are summarised in the following
table:
Number of Words
6 - 8
9 - 11
12 - 14
15 - 17
18 - 20
Frequency
13
10
8
4
3
(a)
Estimate the mean number of words per sentence.
(b)
What is the modal class?
4.
The time taken for people to solve a puzzle is recorded, to the nearest
minute, in the following table:
Time (mins)
2 - 5
6 - 9
10 - 13
14 - 17
18 - 21
Frequency
3
19
20
12
6
Estimate the mean time taken to solve the puzzle.
176
ADVERTISEMENT
0 votes
Related Articles
Related forms

")


 - Cumulative Frequency")
")


Related Categories
Parent category: Education