16 Cumulative Frequency Worksheet Page 23
ADVERTISEMENT
 1
1 2
2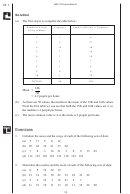 3
3 4
4 5
5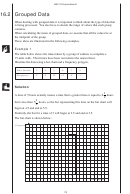 6
6 7
7 8
8 9
9 10
10 11
11 12
12 13
13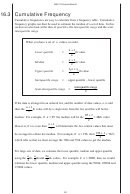 14
14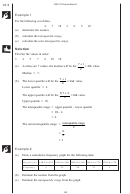 15
15 16
16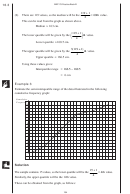 17
17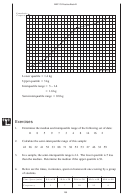 18
18 19
19 20
20 21
21 22
22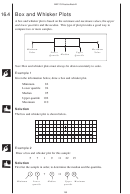 23
23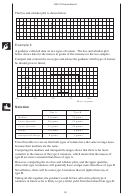 24
24 25
25 26
26 27
27MEP Y9 Practice Book B
16.4 Box and Whisker Plots
A box and whisker plot is based on the minimum and maximum values, the upper
and lower quartiles and the median. This type of plot provides a good way to
compare two or more samples.
Minimum
Maximum
Value
Value
Lower
Upper
Quartile Median
Quartile
Note: Box and whisker plots must always be drawn accurately to scale.
Example 1
Given the information below, draw a box and whisker plot.
Minimum
82
Lower quartile
94
Median
95
Upper quartile
102
Maximum
110
Solution
The box and whisker plot is shown below.
80
90
100
110
Example 2
Draw a box and whisker plot for this sample:
5
7
1
9
11
22
15
Solution
First list the sample in order, to determine the median and the quartiles.
1
5
7
9
11
15
22
Minimum
Lower
Median
Upper Maximum
quartile
quartile
190
ADVERTISEMENT
0 votes
Related Articles
Related forms

")


 - Cumulative Frequency")
")


Related Categories
Parent category: Education