16 Cumulative Frequency Worksheet Page 20
ADVERTISEMENT
 1
1 2
2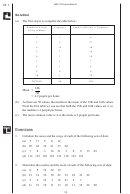 3
3 4
4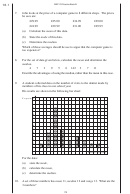 5
5 6
6 7
7 8
8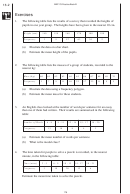 9
9 10
10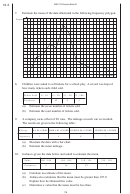 11
11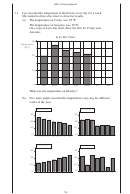 12
12 13
13 14
14 15
15 16
16 17
17 18
18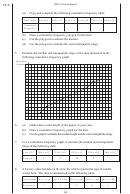 19
19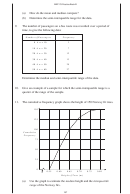 20
20 21
21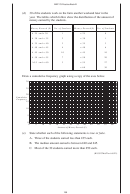 22
22 23
23 24
24 25
25 26
26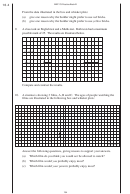 27
27MEP Y9 Practice Book B
(a)
How do the mean and median compare?
(b)
Determine the semi-interquartile range for the data.
9.
The number of passengers on a bus route was recorded over a period of
time, to give the following data:
Number of Passengers
Frequency
≤
<
0
n
10
3
≤
<
10
n
20
7
≤
<
20
n
30
12
≤
<
30
n
40
13
≤
<
40
n
50
29
≤
<
50
n
60
27
Determine the median and semi-interquartile range of the data.
10.
Give an example of a sample for which the semi-interquartile range is a
quarter of the range of the sample.
11.
The cumulative frequency graph shows the height of 150 Norway fir trees.
150
125
100
Cumulative
Frequency
75
50
25
0
0.55
0.60
0.65
0.70
0.75
0.80
Height of Trees (m)
(a)
Use the graph to estimate the median height and the interquartile
range of the Norway firs.
187
ADVERTISEMENT
0 votes
Related Articles
Related forms

")


 - Cumulative Frequency")
")


Related Categories
Parent category: Education