16 Cumulative Frequency Worksheet Page 17
ADVERTISEMENT
 1
1 2
2 3
3 4
4 5
5 6
6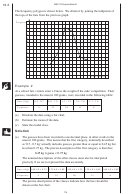 7
7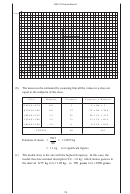 8
8 9
9 10
10 11
11 12
12 13
13 14
14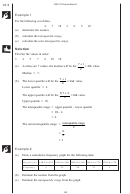 15
15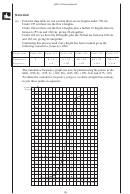 16
16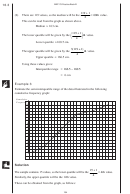 17
17 18
18 19
19 20
20 21
21 22
22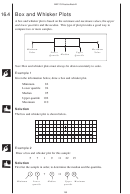 23
23 24
24 25
25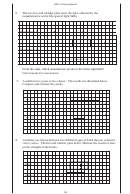 26
26 27
27MEP Y9 Practice Book B
16.3
+
119 1
=
(b)
There are 119 values, so the median will be the
60
th
value.
2
This can be read from the graph as shown above.
≈
Median
163 cm.
+
119 1
The lower quartile will be given by the
th
value.
4
≈
Lower quartile
160.5 cm.
(
)
3 119 + 1
th
The upper quartile will be given by the
value.
4
≈
Upper quartile
166.5 cm.
Using these values gives:
= 166 5 160 5
−
Interquartile range
.
.
=
6 cm
Example 3
Estimate the semi-interquartile range of the data illustrated in the following
cumulative frequency graph:
Cumulative
Frequency
15
14
13
12
11
10
9
8
7
6
5
4
3
2
1
0
5
1
0
4
2
3
Mass (kg)
Solution
+
15 1
= th
The sample contains 15 values, so the lower quartile will be the
4
value.
4
Similarly, the upper quartile will be the 12th value.
These can be obtained from the graph, as follows:
184
ADVERTISEMENT
0 votes
Related Articles
Related forms

")


 - Cumulative Frequency")
")


Related Categories
Parent category: Education