Handbook For Basic Process Improvement Page 28
ADVERTISEMENT
 1
1 2
2 3
3 4
4 5
5 6
6 7
7 8
8 9
9 10
10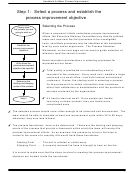 11
11 12
12 13
13 14
14 15
15 16
16 17
17 18
18 19
19 20
20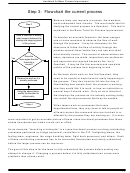 21
21 22
22 23
23 24
24 25
25 26
26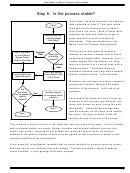 27
27 28
28 29
29 30
30 31
31 32
32 33
33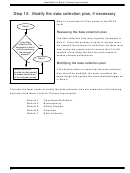 34
34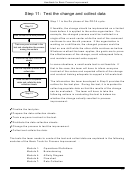 35
35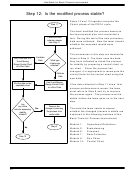 36
36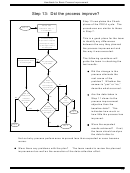 37
37 38
38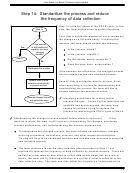 39
39 40
40Handbook for Basic Process Improvement
But what if, over a period of 10 days, a series of times is recorded that averaged 48
minutes? It seems that your getting-off-to-work process now includes making breakfast for
your son and daughter. This is not just a variation. The data indicate that your process
has changed .
While this example portrayed an obvious change in the process, subtle changes often
occur without the knowledge of the workers. These minor changes produce enough
variation to be evident when the data are analyzed. If special cause variation is found in
the process, the team is obliged to find the cause before moving on to the next step in
the model. Depending on the nature of the special cause, the team may act to remove it,
take note of it but no action, or incorporate it in the process.
When special cause variation reduces the effectiveness and efficiency of the process,
the team must investigate the root cause and take action to remove it.
If it is determined that the special cause was temporary in nature, no action may be
required beyond understanding the reason for it. In the example above, the early
phone call caused a variation in the data which was easily explained and required no
further action.
Occasionally, special cause variation actually signals an improvement in the process,
bringing it closer to the process improvement objective. When that happens, the team
may want to incorporate the change permanently.
If the team fails to investigate a signal of special cause variation and continues on with
their improvement activities, the process may be neither stable nor predictable in the
future. This lack of stability and predictability may cause additional problems to occur,
preventing the team from achieving the process improvement objective.
The tools the team needs to assess whether the process is stable are explained in the
following modules of the Basic Tools for Process Improvement :
Module 1:
Operational Definitions
Module 2:
Brainstorming
Module 5:
Cause-and-Effect Diagram
Module 6:
Flowchart
Module 7:
Data Collection
Module 9:
Run Chart
Module 10: Control Chart
24
ADVERTISEMENT
0 votes
Related Articles
Related forms
 - Michigan Department Of State") Form Bfs-152 - Application For Basic Driver Improvement Course Program Electronic Funds Transfer (eft) - Michigan Department Of State
Legal
Form Bfs-152 - Application For Basic Driver Improvement Course Program Electronic Funds Transfer (eft) - Michigan Department Of State
Legal


 Form Jfs 01332 - Child Care Handbook For Caretakers Licensed Type B Home Providers And Certified In-home Aides
Legal
Form Jfs 01332 - Child Care Handbook For Caretakers Licensed Type B Home Providers And Certified In-home Aides
Legal


Related Categories
Parent category: Business