Handbook For Basic Process Improvement Page 37
ADVERTISEMENT
 1
1 2
2 3
3 4
4 5
5 6
6 7
7 8
8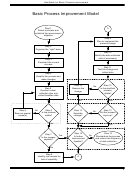 9
9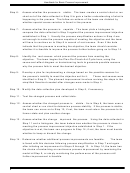 10
10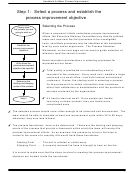 11
11 12
12 13
13 14
14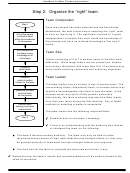 15
15 16
16 17
17 18
18 19
19 20
20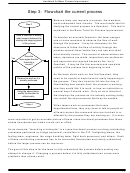 21
21 22
22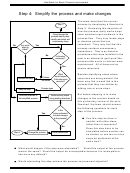 23
23 24
24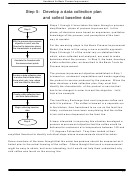 25
25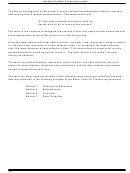 26
26 27
27 28
28 29
29 30
30 31
31 32
32 33
33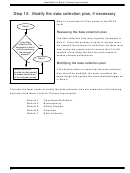 34
34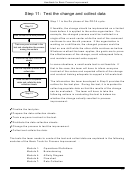 35
35 36
36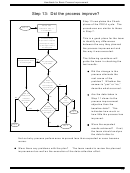 37
37 38
38 39
39 40
40Handbook for Basic Process Improvement
Step 13: Did the process improve?
Step 13 completes the Check
phase of the PDCA cycle. The
Plot the data
procedures are similar to those
Step 12
collected in Step 11
in a Histogram
in Step 7.
This is a good place for the team
Plot the process
to identify any differences
improvement objective
(developed in Step 1)
between the way they planned
as the target value in
the process improvement and
the Histogram
the way it was executed.
The following questions will
Yes
Plot specification limits
guide the team in checking the
Do specification
in the Histogram
limits exist?
test results:
Did the change in the
No
process eliminate the
root cause of the
Does
problem? Whether the
the shape of
answer is “yes” or “no,”
No
the Histogram
approximate a
describe what occurred.
bell curve?
Are all
Are the data taken in
data points
Yes
No
Step 11 closer to the
inside the
Keep
No
the
specification
process improvement
change?
limits?
objective than the
Are the
baseline data? This
Yes
No
data points
close enough to
indicates how much or
Step 9
the target?
how little the process has
Yes
improved.
Yes
Were the expected
Step 9
Step 14
results achieved? If not,
the team should analyze
the data further to
find out why process performance improved less than expected or even became
worse.
Were there any problems with the plan?
The team needs to review the planned
improvement as well as the execution of the data collection effort.
33
ADVERTISEMENT
0 votes
Related Articles
Related forms
 - Michigan Department Of State") Form Bfs-152 - Application For Basic Driver Improvement Course Program Electronic Funds Transfer (eft) - Michigan Department Of State
Legal
Form Bfs-152 - Application For Basic Driver Improvement Course Program Electronic Funds Transfer (eft) - Michigan Department Of State
Legal


 Form Jfs 01332 - Child Care Handbook For Caretakers Licensed Type B Home Providers And Certified In-home Aides
Legal
Form Jfs 01332 - Child Care Handbook For Caretakers Licensed Type B Home Providers And Certified In-home Aides
Legal


Related Categories
Parent category: Business