Quality Assurance Project Plan Including Sampling And Analysis Plan Page 20
ADVERTISEMENT
 1
1 2
2 3
3 4
4 5
5 6
6 7
7 8
8 9
9 10
10 11
11 12
12 13
13 14
14 15
15 16
16 17
17 18
18 19
19 20
20 21
21 22
22 23
23 24
24 25
25 26
26 27
27 28
28 29
29 30
30 31
31 32
32 33
33 34
34 35
35 36
36 37
37 38
38 39
39 40
40 41
41 42
42 43
43 44
44 45
45 46
46 47
47 48
48 49
49 50
50 51
51 52
52 53
53 54
54 55
55 56
56 57
57 58
58 59
59 60
60 61
61 62
62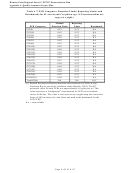 63
63 64
64 65
65 66
66 67
67Hunters Point Shipyard Parcel F ESTCP Demonstration Plan
Appendix A: Quality Assurance Project Plan
However, the project will not be compromised if 90% of the samples collected are analyzed with
acceptable quality.
Comparability is a measure of the confidence with which one data set can be compared to
another. This is a qualitative assessment and is addressed primarily in sampling design through
use of comparable sampling procedures or, for monitoring programs, through accurate resampling
of stations over time. In the laboratory, comparability is ensured through the use of comparable
analytical procedures and ensuring that project staff are trained in the proper application of the
procedures. Within-study comparability will be assessed through analytical performance (QC
samples).
Representativeness is the degree to which data accurately and precisely represent a characteristic
of a population. This is a qualitative assessment and is addressed primarily in the sample design,
through the selection of sampling sites and procedures that reflect the project goals and
environment being sampled. It is ensured in the laboratory through (1) the proper handling,
homogenizing, compositing, and storage of samples and (2) analysis within the specified holding
times so that the material analyzed reflects the material collected as accurately as possible.
Sensitivity is the capability of a test method or instrument to discriminate between measurement
responses representing different levels (e.g., concentrations) of a variable of interest. Sensitivity is
addressed primarily through the selection of appropriate analytical methods, equipment, and
instrumentation. The methods selected for this study were chosen to provide the sensitivity
required for the end-use of the data. This is a quantitative assessment and is monitored through
the instrument calibrations and calibration verification samples and the analysis of procedural
blanks with every analytical batch.
Method Detection Limits for PCB congeners in tissues are determined by spiking clean, low-
lipid tissue (e.g., white meat fillet from a non-bottom-feeding fish species) with all parameters of
interest and processing them according to the methods defined Section A.3.4. MDLs for Gas
chromatography/electron-capture detector (GC/ECD) analysis are determined on the primary
column. (MDLs for PCBs must also be determined on a confirmation column if data from
confirmatory analyses will be reported. In these instances, the MDLs determined from
confirmation column analysis must be less than those determined from the primary column.
Quantification on confirmation columns is not, however, anticipated for this investigation.)
Reporting Limits (RLs) for PCB congeners are empirical values based on a low calibration
standard (≤0.005 µg/mL), instrument sensitivity, and day-to-day operations. Sample-specific
reporting limits will be calculated and reported with the final data. For PCB congeners, the RL is
calculated as
RL = (Low Standard Concentration) (Preinjection Volume) (Dilution Factors) (1/ Sample Size)
The DoD Quality Systems Manual (DoD, 2002) includes the following note: There may be
numbers reported to the client that are below the reporting limit. These numbers must be flagged
appropriately. When the analysis demonstrates a non-detect at the MDL, the data shall be
flagged with a “U.” The value reported to the client is the MDL, adjusted by any dilution factor
used in the analysis. When an analyte is detected between the lower quantitation limit and the
MDL, the data shall be flagged with a “J.” The value reported is an estimate.
Page A-
20
of A-67
ADVERTISEMENT
0 votes
Related Articles
Related forms


Related Categories
Parent category: Business