Quality Assurance Project Plan Including Sampling And Analysis Plan Page 27
ADVERTISEMENT
 1
1 2
2 3
3 4
4 5
5 6
6 7
7 8
8 9
9 10
10 11
11 12
12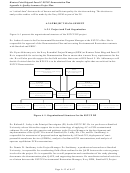 13
13 14
14 15
15 16
16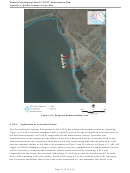 17
17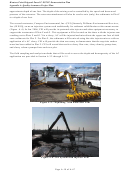 18
18 19
19 20
20 21
21 22
22 23
23 24
24 25
25 26
26 27
27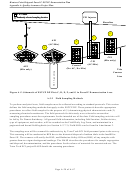 28
28 29
29 30
30 31
31 32
32 33
33 34
34 35
35 36
36 37
37 38
38 39
39 40
40 41
41 42
42 43
43 44
44 45
45 46
46 47
47 48
48 49
49 50
50 51
51 52
52 53
53 54
54 55
55 56
56 57
57 58
58 59
59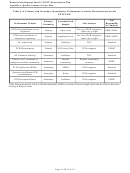 60
60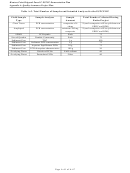 61
61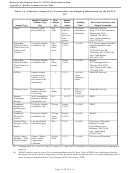 62
62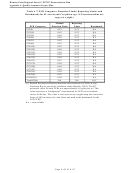 63
63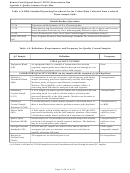 64
64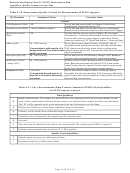 65
65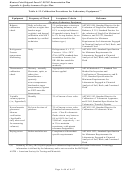 66
66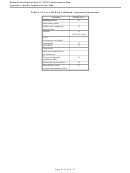 67
67Hunters Point Shipyard Parcel F ESTCP Demonstration Plan
Appendix A: Quality Assurance Project Plan
A.3.0 STUDY DESIGN, DATA GENERATION AND ACQUISITION
This section describes the method requirements for all aspects of data measurement and acquisition:
collection, handling, and analysis of samples; QC procedures and requirements; and data management.
The overall purpose of this project is to demonstrate that AC sorbent mixed with sediment is a cost-
effective, in situ, non-removal, management strategy for reducing the bioavailability of PCBs in offshore
sediments at HPS site.
A.3.1
Sampling Process Design (Experimental Design)
The field data will be obtained by collecting samples according to the Sampling Design shown in Table
A-1. Table A-4 defines the measurements associated with the primary and secondary performance
criteria, respective lab samples, and laboratories responsible for analyses. Table A-5 defines the total
number of samples that will be collected during the entire ESTCP DP and the intended analyses.
This project is designed to compare the effectiveness of two available large-scale mixing technologies,
demonstrate that AC treatment reduces aqueous PCB availability and PCB bioaccumulation in field tests,
and evaluate sediment resuspension and PCB release. To achieve these objectives, five test plots of 370
2
ft
area will be used in the field study and analyzed once before and twice after treatments occurs as
shown in Table A-1. As discussed in Section 2.4.1, various treatments will be applied to four of the five
plots, leaving one plot (Plot E) to serve as a control. A schematic of these five plots, labeled with
respective treatments, is shown in Figure A-5. Plot C will be treated by mixing the sediment with the
Aquamog rotovator, but without applying AC. Plot G will be treated by mixing with the CEI slurry
injector system, but without applying AC. Plots D and F will be treated by applying a 3.4 wt.% AC and
mixing it into the sediment with the Aquamog and CEI slurry injector system, respectively. The AC dose
will be applied to an approximate depth of one foot, corresponding to the biologically active zone. The
shapes of the Plots C and D were made to fit the radial design of the Aquamog’s rotovator arm. The
shapes of Plots F and G were chosen to fit the design of CEI’s equipment. All of the plots were made to
follow the contour line of the tides so that similar benthic communities would exist in each of the plots at
the beginning of the study.
In each of the five plots, there will be five sampling locations, as shown in Figure A-5. These five
sampling locations in each plot have been selected using a stratified random sampling strategy. This
sampling strategy ensures that the sampling locations are spatially distributed, and meet the criterion of
random sampling so that statistical tests can be applied during data analysis. To obtain the five stratified
random sampling locations for a given plot, each plot was divided into five equal sub-areas containing the
same number of possible sampling locations. The outside 3-foot edge of the plots was not be included in
the selection process to ensure that the sampling locations are located within the actual treatment area. In
each sub-area, a random sampling location was selected. The resulting randomly-selected sampling
locations are shown in Figure 3-6 for each plot. These same sampling locations for the five plots will be
used in all three sampling time points so that pair-wise comparisons can be made over time when
appropriate.
Page A-
27
of A-67
ADVERTISEMENT
0 votes
Related Articles
Related forms


Related Categories
Parent category: Business