Quality Assurance Project Plan Including Sampling And Analysis Plan Page 63
ADVERTISEMENT
 1
1 2
2 3
3 4
4 5
5 6
6 7
7 8
8 9
9 10
10 11
11 12
12 13
13 14
14 15
15 16
16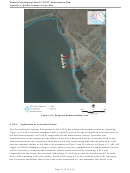 17
17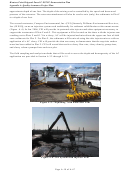 18
18 19
19 20
20 21
21 22
22 23
23 24
24 25
25 26
26 27
27 28
28 29
29 30
30 31
31 32
32 33
33 34
34 35
35 36
36 37
37 38
38 39
39 40
40 41
41 42
42 43
43 44
44 45
45 46
46 47
47 48
48 49
49 50
50 51
51 52
52 53
53 54
54 55
55 56
56 57
57 58
58 59
59 60
60 61
61 62
62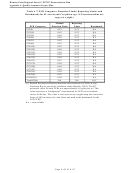 63
63 64
64 65
65 66
66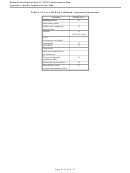 67
67Hunters Point Shipyard Parcel F ESTCP Demonstration Plan
Appendix A: Quality Assurance Project Plan
Table A-7. PCB Congeners, Detection Limits, Reporting Limits, and
Benchmarks for M. nasuta and Corophium spp. (All concentrations are
ng/g wet weight.)
Method
Reporting
PCB Congeners
Detection Limit
Limit
Benchmark
Cl2(8)
0.32
0.22
NA
Cl3(18)
0.03
0.22
NA
Cl3(28)
0.04
0.22
NA
Cl4(44)
0.03
0.22
NA
Cl4(52)
0.02
0.22
NA
Cl4(66)
0.03
0.22
NA
Cl5(101)
0.02
0.22
NA
Cl5(105)
0.04
0.22
NA
Cl5(118)
0.04
0.22
NA
Cl6(128)
0.09
0.22
NA
Cl6(138)
0.04
0.22
NA
Cl6(153)
0.07
0.22
NA
Cl7(170)
0.04
0.22
NA
Cl7(180)
0.04
0.22
NA
Cl7(187)
0.04
0.22
NA
Cl8(195)
0.04
0.22
NA
Cl9(206)
0.03
0.22
NA
Cl10(209)
0.04
0.22
NA
(a)
Total PCBs
NA
NA
13.8
(a) Battelle developed reference threshold concentrations for PCBs in San
th
Francisco Bay as part of the validation study (Battelle, 2003). The 90
percentile value for total PCBs was approximately 69 µg/kg dry wt. This
value represents a “background” concentration for PCBs in invertebrate
tissues in the bay. This value is converted to wet weight using the conversion
factor of 80% moisture for clam tissue and used as the benchmark for the
ESTCP DP.
NA = not available.
Page A-
63
of A-67
ADVERTISEMENT
0 votes
Related Articles
Related forms


Related Categories
Parent category: Business