Quality Assurance Project Plan Including Sampling And Analysis Plan Page 55
ADVERTISEMENT
Hunters Point Shipyard Parcel F ESTCP Demonstration Plan
Appendix A: Quality Assurance Project Plan
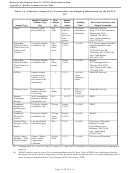
Table A-1. Schedule of Plot Sampling and Analysis
t = Months
Sampling Description
Since
Treatment
Pre-Treatment Sampling
• Collect duplicate water samples in the five plots to measure aqueous and suspended
particulate PCB concentrations in the water column during high tide.
• Deploy clams, five replicate enclosures in the five plots.
• Deploy SPMDs, five replicates in the five plots.
• Take five, two-inch diameter core samples in the five plots for analysis of TOC and
t = -1.5
sediment PCB concentrations, aqueous equilibrium PCB concentrations, and PCB
desorption rates.
• Sieve surface sediment quadrats to collect benthic community samples
• Sieve surface sediment samples to collect amphipod samples.
• Remove clams for PCB congener analysis.
t = -0.5
• Remove SPMDs for PCB congener analysis.
Mixing and AC Treatments
• Apply various treatments to four of the five plots.
t = 0
Post-Treatment Samplings
• Collect duplicate water samples in the five plots to measure aqueous and suspended
t = 0.05
particulate PCB concentrations in the water column during high tide.
• Collect duplicate water samples in the five plots to measure aqueous and suspended
t = 5
particulate PCB concentrations in the water column during high tide.
• Deploy clams, five replicate enclosures in the five plots.
• Deploy SPMDs, five replicates in the five plots.
• Take five, two-inch diameter core samples in the five plots for analysis of TOC and
t = 5.5
sediment PCB concentrations, aqueous equilibrium PCB concentrations, and PCB
desorption rates.
• Sieve surface sediment quadrats to collect benthic community samples
• Sieve surface sediment samples to collect amphipod samples.
• Remove clams for PCB congener analysis.
t = 6.5
• Remove SPMDs for PCB congener analysis.
• Collect duplicate water samples in the five plots to measure aqueous and suspended
t = 17
particulate PCB concentrations in the water column during high tide.
• Deploy clams, five replicate enclosures in the five plots.
• Deploy SPMDs, five replicates in the five plots.
• Take five, two-inch diameter core samples in the five plots for analysis of TOC and
t = 17.5
sediment PCB concentrations, aqueous equilibrium PCB concentrations, and PCB
desorption rates.
• Sieve surface sediment quadrats to collect benthic community samples
• Sieve surface sediment samples to collect amphipod samples.
• Remove clams for PCB congener analysis.
t = 18.5
• Remove SPMDs for PCB congener analysis.
Page A-
55
of A-67
ADVERTISEMENT
0 votes
Related Articles
Related forms
Related Categories
Parent category: Business
 1
1 2
2 3
3 4
4 5
5 6
6 7
7 8
8 9
9 10
10 11
11 12
12 13
13 14
14 15
15 16
16 17
17 18
18 19
19 20
20 21
21 22
22 23
23 24
24 25
25 26
26 27
27 28
28 29
29 30
30 31
31 32
32 33
33 34
34 35
35 36
36 37
37 38
38 39
39 40
40 41
41 42
42 43
43 44
44 45
45 46
46 47
47 48
48 49
49 50
50 51
51 52
52 53
53 54
54 55
55 56
56 57
57 58
58 59
59 60
60 61
61 62
62 63
63 64
64 65
65 66
66 67
67


