Quality Assurance Project Plan Including Sampling And Analysis Plan Page 58
ADVERTISEMENT
 1
1 2
2 3
3 4
4 5
5 6
6 7
7 8
8 9
9 10
10 11
11 12
12 13
13 14
14 15
15 16
16 17
17 18
18 19
19 20
20 21
21 22
22 23
23 24
24 25
25 26
26 27
27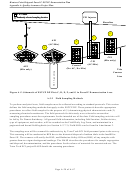 28
28 29
29 30
30 31
31 32
32 33
33 34
34 35
35 36
36 37
37 38
38 39
39 40
40 41
41 42
42 43
43 44
44 45
45 46
46 47
47 48
48 49
49 50
50 51
51 52
52 53
53 54
54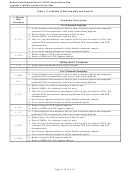 55
55 56
56 57
57 58
58 59
59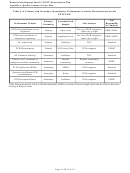 60
60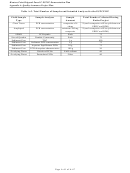 61
61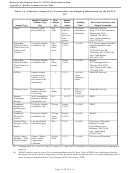 62
62 63
63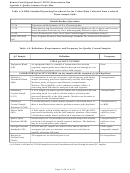 64
64 65
65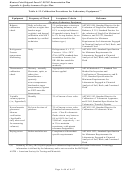 66
66 67
67Hunters Point Shipyard Parcel F ESTCP Demonstration Plan
Appendix A: Quality Assurance Project Plan
Table A-3. Data Quality Objectives for Secondary Quant. Performance Criteria of
ESTCP DP
STEP 1: State the Problem
Experiments that add additional support to the primary quantitative data quality objectives/performance criteria
listed in Table A-2 are required to fully assess the AC treatment technology. These experiments are needed to:
1) validate that the AC treatment reduces aqueous PCB availability in the field (biomimetic semi-permeable
membrane devices (SPMDs), aqueous equilibrium studies, and desorption studies),
2) assess AC treatment effects on benthic recolonization, community structure, and organism growth, and
3) assess the stability of the AC/sediment mix.
STEP 2: Identify the Decision
PRIMARY DECISION
1. Will AC treatment reduce aqueous PCB availability in field sediment?
2. Will AC treatment affect the indigenous benthic community?
3. Will the AC/sediment mix remain stable over time?
STEP 3: Identify Inputs to the Decision
1. a. Aqueous PCB measurements in equilibrium with sediment subsamples taken from plot cores once before
and twice after plot treatments.
b. PCB desorption rates for sediment subsamples taken from plot cores once before and twice after plot
treatments.
c. PCB uptake into SPMDs placed into plots once before and twice after plot treatments.
d. PCB congeners in a homogenate of the entire sediment core taken from test plots before and after AC
treatment.
2. Community structure analyses of benthic organisms found in each of the sieved quadrats taken once before
and twice after plot treatments.
3. Total Organic Carbon (TOC) values measured for sediment cores from Plots D and F taken after six and
eighteen months will compared to evaluate if there are any significant differences in the amount of AC in these
plots between the two sampling time points.
STEP 4: Define the Study Boundaries
1. The study area is approximately 100 ft offshore in Area X off the mid-eastern South Basin shoreline. Five 370
2
ft
test plots will be located in the study area, all equidistant from the shoreline.
2. The vertical limit of the study area will be a depth of 1.5 ft.
3. The plot treatments and field sampling schedule are constrained by the low tide schedule.
STEP 5: Develop a Decision Rule
PRIMARY DECISION RULE (Sampling design quantitatively focuses on this decision rule)
1. a. If the aqueous equilibrium PCB concentrations for the AC-treated plots (Plots D and F) are significantly
lower when compared to control plots (Plots C, E, and G) using an appropriate statistical method, then these
results indicate that AC treatment reduces aqueous PCB availability in field sediment.
b. If the PCB desorption rates for the AC-treated plots (Plots D and F) are significantly lower when compared
to control plots (Plots C, E, and G) using an appropriate statistical method, then these results indicate that AC
treatment reduces the PCB desorption rate from field sediments.
c. If the SPMD PCB uptake data for AC-treated plots (Plots D and F) are significantly lower when compared
to control plots (Plots C, E, and G) using an appropriate statistical method, then these results indicate that AC
treatment reduces PCB uptake into a biomimetic device.
2. If metrics of benthic community structure (e.g., total taxa richness, total abundance, relative amphipod
abundance, and various multi-metric indices) of AC-treated plots (Plots D and F) are not statistically
significantly reduced compared to that of the control plots (Plots C, E and G) then the AC application does not
affect the benthic community structure. However, if a statistically significant difference (increase or decrease)
does exist between treated and control plots in any metric of biological integrity, then the analysis of the
community structure will be used to calculate the treatment effects on benthic recolonization. Determination
of statistical differences in measures of biological integrity will be performed by one-way analysis of variance.
3. If there are no significant differences (by appropriate statistical test) between the six-month and eighteen-
month TOC values measured in cross sections of sediment cores taken from Plots D and F, then the
AC/sediment mix is stable in the timeframe of the study.
Page A-
58
of A-67
ADVERTISEMENT
0 votes
Related Articles
Related forms


Related Categories
Parent category: Business