Quality Assurance Project Plan Including Sampling And Analysis Plan Page 59
ADVERTISEMENT
 1
1 2
2 3
3 4
4 5
5 6
6 7
7 8
8 9
9 10
10 11
11 12
12 13
13 14
14 15
15 16
16 17
17 18
18 19
19 20
20 21
21 22
22 23
23 24
24 25
25 26
26 27
27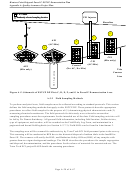 28
28 29
29 30
30 31
31 32
32 33
33 34
34 35
35 36
36 37
37 38
38 39
39 40
40 41
41 42
42 43
43 44
44 45
45 46
46 47
47 48
48 49
49 50
50 51
51 52
52 53
53 54
54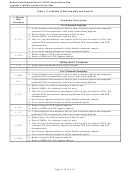 55
55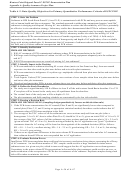 56
56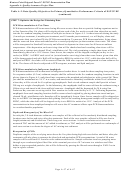 57
57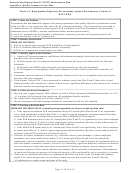 58
58 59
59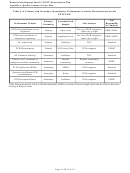 60
60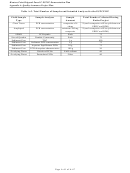 61
61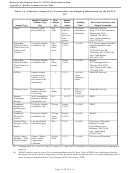 62
62 63
63 64
64 65
65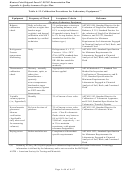 66
66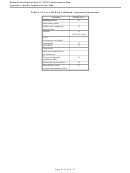 67
67Hunters Point Shipyard Parcel F ESTCP Demonstration Plan
Appendix A: Quality Assurance Project Plan
Table A-3. Data Quality Objectives for Secondary Quant. Performance Criteria of ESTCP DP
(continued)
STEP 6: Evaluate Decision Errors
Just the mixing of sediments in Plots C, D, F, and G will have a large impact on the community structure.
Quadrats to assess community structure will be taken six and eighteen months after the treatments occur to give
the benthic community time to reestablish itself. If this time period is insufficient, then it will be difficult to
decide if it was the mixing or actual AC that affected the community structures.
STEP 7: Optimize the Design for Obtaining Data
Sediment PCB and Aqueous Equilibrium PCB Concentrations
Subsamples from the total of 75 cores will be analyzed for total PCB sediment concentrations and aqueous
equilibrium concentration of PCBs.
Sediment PCBs Desorption Characteristics
Subsamples from two sediment cores per plot (taken once before and twice after treatments) will be analyzed to
evaluate PCB desorption characteristics. The desorption tests on the sediment core subsamples will follow
previously published methods (Ghosh et al., 2000) These analyses will allow us to assess the change in PCB
availability for desorption to the aqueous phase after treatment.
Benthic Community Structure Analyses
Surface sediment (0-10 cm) will collected from five randomly selected 0.25-m quadrats per plot once before and
twice after plot treatments. The benthic organisms existing in these quadrat sediment samples will be sieved using
a 500µm sieve, preserved in 10% formaldehyde solution in the field, and transferred to the laboratory in 500mL
polyethylene jars. A total of 75 quadrats will be sieved during the entire study producing 75 benthic community
samples. By comparing the macrofaunal composition that exists in the benthic community samples collected
before and after treatments, the AC treatment effects upon benthic recolonization, community structure and
organism growth can be determined.
PCB Uptake into SPMDs
Five semi-permeable membrane devices (SPMDs) will be deployed inside of the clam tubes in each plot once
before and twice after plot treatments. A total of 75 SPMDs will be deployed during the entire project.
Measurement of PCB uptake into these devices will simulate the in situ bioavailability of PCBs to biota. The
SPMDs will be vertically oriented 3 cm below the sediment surface inside each clam tube. The SPMDs will be
contacted with sediment for one month before removal, processing, and analysis.
Depth and Homogeneity of the Mixed AC
In each plot, 2.0-inch-diameter sediment core samples will be collected at five randomly distributed sampling
locations once before and twice after plot treatments. Each of the core samples collected will be one foot in length
(minimum) and divided into 2-inch-long core cross sections. A direct correlation exists between measured TOC
and the amount of AC added in sediment, so TOC analysis will be performed on a subsample of each core section
to evaluate the degree of AC mixing into sediment.
Stability of AC/Sediment Mix
Total Organic Carbon (TOC) values measured for sediment cores from Plots D and F taken after six and eighteen
months will compared to evaluate if there are any significant differences in the amount of AC in these plots
between the two sampling time points.
Page A-
59
of A-67
ADVERTISEMENT
0 votes
Related Articles
Related forms


Related Categories
Parent category: Business