Annual Performance Plan - 2014, Revised Final Performance Plan - 2013 Page 78
ADVERTISEMENT
 1
1 2
2 3
3 4
4 5
5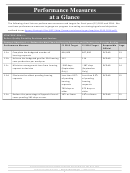 6
6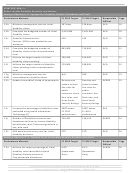 7
7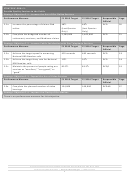 8
8 9
9 10
10 11
11 12
12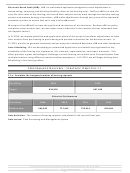 13
13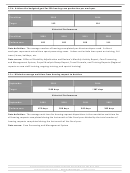 14
14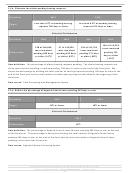 15
15 16
16 17
17 18
18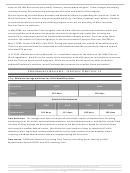 19
19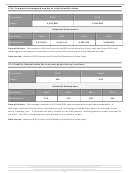 20
20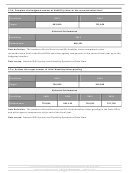 21
21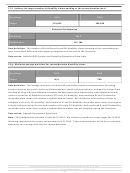 22
22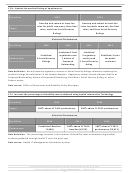 23
23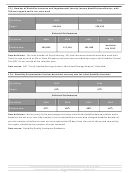 24
24 25
25 26
26 27
27 28
28 29
29 30
30 31
31 32
32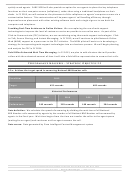 33
33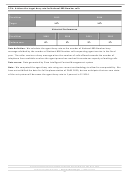 34
34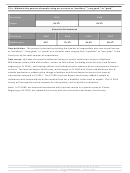 35
35 36
36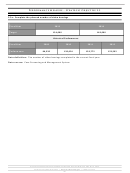 37
37 38
38 39
39 40
40 41
41 42
42 43
43 44
44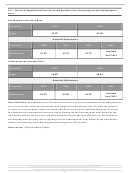 45
45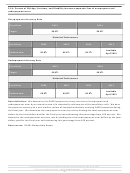 46
46 47
47 48
48 49
49 50
50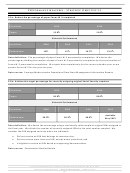 51
51 52
52 53
53 54
54 55
55 56
56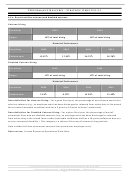 57
57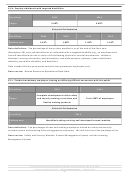 58
58 59
59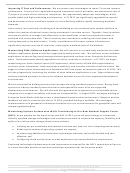 60
60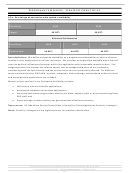 61
61 62
62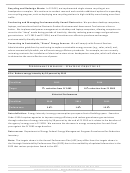 63
63 64
64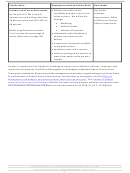 65
65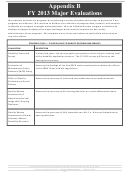 66
66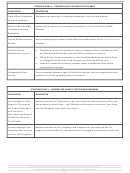 67
67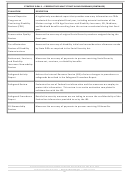 68
68 69
69 70
70 71
71 72
72 73
73 74
74 75
75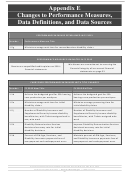 76
76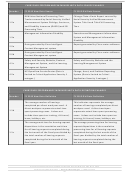 77
77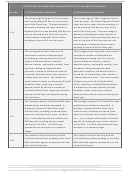 78
78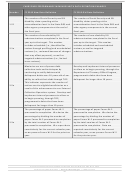 79
79 80
80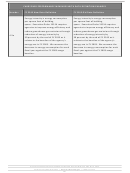 81
81 82
82 83
83 84
84 85
85 86
86 87
87 88
88 89
89CARRYOVER PERFORMANCE MEASURES WITH DATA DEFINITION CHANGES
Number
FY 2013 New Data Definition
FY 2012 Old Data Definition
The percentage of Appeals Council cases
The percentage of oldest Appeals Council
that are pending 365 days or over at the
cases pending. The oldest Appeals Council
end of the fiscal year. The percentage is
cases are those cases that are pending, or
derived by dividing the total number of
will be pending, 365 days or over at the
Appeals Council cases pending 365 days or
end of the fiscal year. The percentage is
1.1e
over at the end of the fiscal year by the
derived by dividing the total number of
total number of Appeals Council cases
Appeals Council cases pending 365 days or
pending at the end of the fiscal year.
over at the end of the fiscal year by the
total number of Appeals Council cases
pending at the end of the fiscal year.
The average wait time is the overall
The average processing time is the overall
cumulative number of elapsed days
cumulative number of elapsed days
(including processing times for transit,
(including processing times for transit,
technical determinations, medical
technical determinations, medical
determinations, and quality review) from
determinations, and quality review) from
the date of filing through the date
the date of filing through the date
payment is made or the denial notice is
payment is made or the denial notice is
1.2a
issued for all initial claims that require a
issued for all initial claims that require a
medical determination. We divide the
medical determination. The total number
total number of days to complete all initial
of days to process all initial disability
disability claims requiring a medical
claims requiring a medical determination
determination by the total number of
is divided by the total number of initial
initial disability claims requiring a medical
disability claims requiring a medical
determination that we complete during
determination that we process during the
the fiscal year.
fiscal year.
The average number of all State DDS cases
The average number of all State DDS cases
produced per workyear expended. A
produced per workyear expended. A
workyear represents both direct and
workyear represents both direct and
indirect time, including overhead (time
indirect time, including overhead (time
spent on training, travel, leave, holidays,
spent on training, travel, leave, holidays,
1.2c
etc.). It includes the time of staff on the
etc.). It is inclusive of all staff on the DDS
DDS payroll, including doctors under
payroll, including doctors under contract
contract to the DDS. The DDS case
to the DDS. The DDS case production per
production per workyear is a national
workyear is a national target.
target.
The number of Social Security and SSI
The number of Social Security and SSI
initial disability claims pending in the State
initial disability claims pending in the State
1.2e
DDS and other agency components at the
DDS and other agency components in the
end of the fiscal year.
current fiscal year.
Annual Performance Plan for FY 2014 and Revised Final Performance Plan for FY 2013
Social Security Administration |
| 1-800-772-1213
78
ADVERTISEMENT
0 votes
Related Articles
Related forms


Related Categories
Parent category: Legal