Inventory Control Guide Page 15
ADVERTISEMENT
 1
1 2
2 3
3 4
4 5
5 6
6 7
7 8
8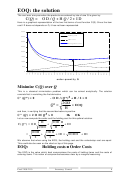 9
9 10
10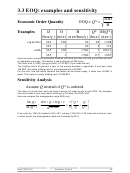 11
11 12
12 13
13 14
14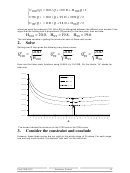 15
15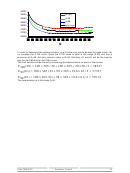 16
16 17
17 18
18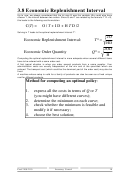 19
19 20
20 21
21 22
22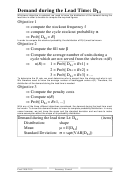 23
23 24
24 25
25 26
26 27
27 28
28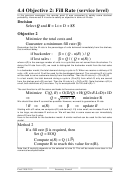 29
29 30
30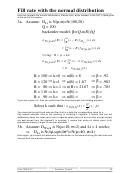 31
31 32
32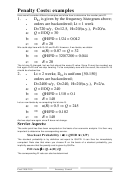 33
33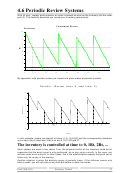 34
34 35
35 36
36 37
37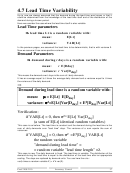 38
38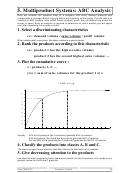 39
39 40
40=
+
+
C
( ) OD /
Q
Q
100 D H
Q
/ 2
100
100
=
+
+
C ( )
Q
OD /
Q
99 D H
Q
/ 2
99
99
=
+
+
C ( )
Q
OD /
Q
98 D H
Q
/ 2
98
98
where we used the subscript (100, 99 or 98) to distinguish between the different cost models. If we
argue that the holding cost is proportional (20 percent) to the item price, then we have:
=
=
=
H
20 0
.
, H
19 8
.
, H
19 6
.
100
99
98
The next step consists in getting the minima for each of these cost curves.
2.
Solve
Solving over Q then gives the following (very close) values:
2OD
2OD
2OD
*
*
*
=
=
=
Q
,
Q
,
Q
100
99
98
H
H
H
100
99
98
Here are the three costs functions using D=365 u/y, O=100$. On the charts, “tc” stands for
total cost.
40000
tc-100
39500
tc-99
39000
tc-98
38500
38000
37500
37000
36500
36000
Q
The arrows indicate the minimum on the C100 and on the C98 curves.
3.
Consider the constraint and conclude
However, these three curves are not valid on the whole range of Q values. For each range,
one and only curve is valid. It is denoted "total cost" on the next chart.
Prod 2100-2110
Inventory Control
14
ADVERTISEMENT
0 votes
Related Articles
Related forms


Related Categories
Parent category: Education