Inventory Control Guide Page 28
ADVERTISEMENT
 1
1 2
2 3
3 4
4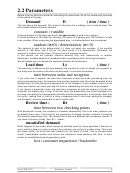 5
5 6
6 7
7 8
8 9
9 10
10 11
11 12
12 13
13 14
14 15
15 16
16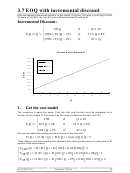 17
17 18
18 19
19 20
20 21
21 22
22 23
23 24
24 25
25 26
26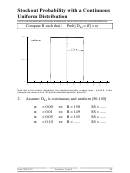 27
27 28
28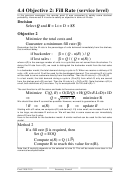 29
29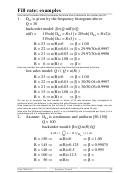 30
30 31
31 32
32 33
33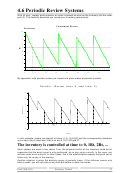 34
34 35
35 36
36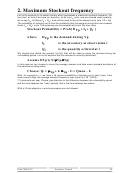 37
37 38
38 39
39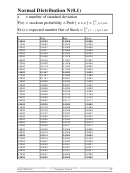 40
40Stockout Probability with a Normal
Distribution
Let us now consider the normal distribution. Here are several examples with a mean of 100
and different standard deviations. Try in these three examples to get some feeling about the
average of a distribution and about its standard deviation.
0.02
sigma=20
sigma=30
sigma=60
0.01
0
> R ] = α
Compute R such that : Prob[ D
Lt
is N( µ , σ )=N(100,20)
3a. Assume: D
Lt
⇔
α = 0.5
(0 σ )
! R = 100
⇔
α = 0.16
(1 σ )
! R = 120
⇔
α = 0.02
(2 σ )
! R = 140
⇔
α = .......
(1/2 σ )
! R = 110
⇔
α = 0.05
(? σ )
! R =
The values of R are chosen equal to the mean plus a number of standard deviations. This
number defines the stockout probability α.
µ σ
>
=
>
Pr[
D
R
] Pr[ ( , )
N
R
]
Lt
µ σ
α
=
>
−
=
Pr[ (
N
0 1
,
) (
R
) / ]
In the following example, you need to compute the distribution of the demand during the lead
time by convoluting(summing) distributions. It is easy with normal distributions.
is N( µ=10 , σ=2 ) and Lt = 4 weeks;
3b. Assume: D
Week
is N(4 µ ,sqrt(4 σ
2
)=N( µ=40 , σ=4 )
D
Lt
Prod 2100-2110
Inventory Control
27
ADVERTISEMENT
0 votes
Related Articles
Related forms


Related Categories
Parent category: Education