Inventory Control Guide Page 18
ADVERTISEMENT
 1
1 2
2 3
3 4
4 5
5 6
6 7
7 8
8 9
9 10
10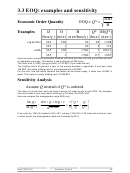 11
11 12
12 13
13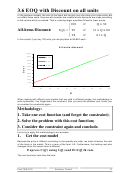 14
14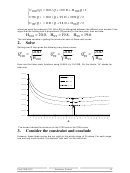 15
15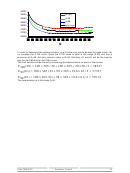 16
16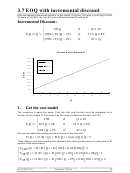 17
17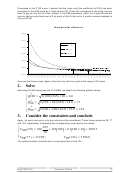 18
18 19
19 20
20 21
21 22
22 23
23 24
24 25
25 26
26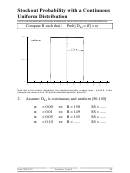 27
27 28
28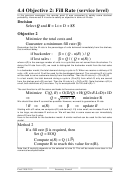 29
29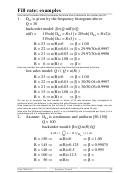 30
30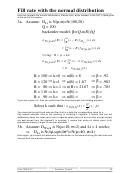 31
31 32
32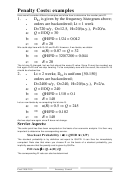 33
33 34
34 35
35 36
36 37
37 38
38 39
39 40
40Compared to the C100 curve, it seems that the order cost (the coefficient of D/Q) has been
increased in the C98 curve by a fixed amount 60. These 60 correspond to the extra cost we
have to pay for the first 30 units. Indeed, in the C98 expression, each unit is paid 98 and we
have to add an extra fixed cost of 2 for each of the 30 first units. A similar comment applies to
the curve C95.
Incremental discount
48000
46000
tc-100
44000
tc-98
tc-95
42000
40000
38000
36000
Here are the three curves. Again, there are only valid on a part of the range of Q values.
2.
Solve
Assuming D=365 items/year and O=100Bef, we obtain the following optimal values.
*
=
≈
Q
2 100 365 20
(
)(
) /
60
100
*
=
+
≈
Q
2 100 60 365 19 6
(
)(
) /
.
77
98
*
=
+
≈
Q
2 100 300 365 19 0 124
(
)(
) /
.
95
3.
Consider the constraints and conclude
Again, for each cost curve, only one value must be considered. These three values are 30, 77
and 124, respectively. Computing the corresponding costs lead to the values:
365
[
]
[
]
=
+
+
×
≈
C
( )
30
100
365 100
01 100 30
.
38017
100
30
≈
≈
C
( )
77
37289
;
C
(
124
)
37060
98
95
The optimal solution consists thus in ordering by lots of size 124.
Prod 2100-2110
Inventory Control
17
ADVERTISEMENT
0 votes
Related Articles
Related forms


Related Categories
Parent category: Education