Inventory Control Guide Page 31
ADVERTISEMENT
 1
1 2
2 3
3 4
4 5
5 6
6 7
7 8
8 9
9 10
10 11
11 12
12 13
13 14
14 15
15 16
16 17
17 18
18 19
19 20
20 21
21 22
22 23
23 24
24 25
25 26
26 27
27 28
28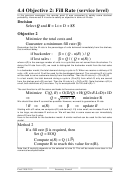 29
29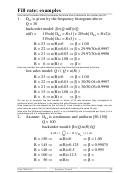 30
30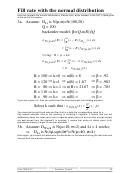 31
31 32
32 33
33 34
34 35
35 36
36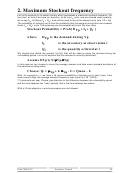 37
37 38
38 39
39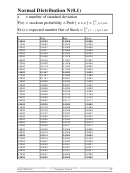 40
40Fill rate with the normal distribution
Here we consider the normal distributions. Please refer, when needed, to the N(0,1) table given
at the end of the section.
is N( µ , σ )=N(100,20)
3a. Assume: D
Lt
Q = 100
backorder model: β =( Q -n( R ))/ Q
∞
=
−
n
( )
R
(
x R f
)
( )
x dx
µ σ
N
( , )
D
R
Lt
∞
=
−
(
x R f
)
( )
x dx
µ σ
N
( , )
R
µ
σ
=
+
Using:
R
k
∞
σ
=
−
n
( )
R
(
x k f
)
( )
x dx
µ σ
N
( , )
N
( , )
0 1
k
σ
=
n
( )
k
N
( , )
0 1
β = .92
R = 100
k=0
n(R) = 8
β = .983
R = 120
k=1
n(R) = 1.67
β = .783
R = 80
k=-1
n(R) = 21.67
β =
R = 110
k=
n(R) =
β =
R = 90
k=
n(R) =
If you are a given a β, then you could invert the formulae to get the following equation:
Q
β
Select k such that :
=
−
n
( )
k
(
1
)
N
( , )
0 1
σ
You compute the right hand side and then find in a table the corresponding value for k.
Pay special attention here to the meaning of choosing k negative. It means that you will
deliberately delay the order point (use a negative safety stock) to be sure that enough people
are not served from the shelves!!! In practice, it means that using no safety stock (k=0)
guarantees already a larger fill rate than specified !
is N( µ=10 , σ=2 ) and Lt = 4 weeks;
3b. Assume: D
Week
is N(4 µ ,sqrt(4 σ
2
)=N( µ=40 , σ=4 )
D
Lt
Here again, you should first determine the distribution of the demand during the lead time and
then perform the previous calculations.
Prod 2100-2110
Inventory Control
30
ADVERTISEMENT
0 votes
Related Articles
Related forms


Related Categories
Parent category: Education