Inventory Control Guide Page 33
ADVERTISEMENT
 1
1 2
2 3
3 4
4 5
5 6
6 7
7 8
8 9
9 10
10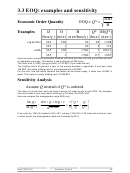 11
11 12
12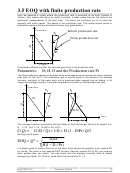 13
13 14
14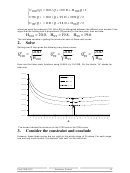 15
15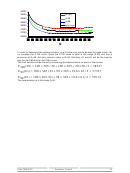 16
16 17
17 18
18 19
19 20
20 21
21 22
22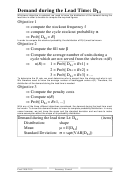 23
23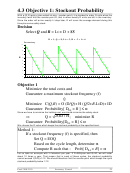 24
24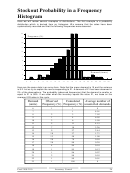 25
25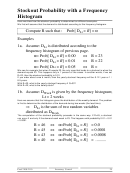 26
26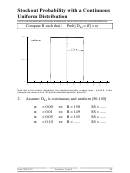 27
27 28
28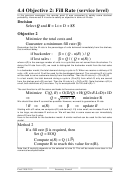 29
29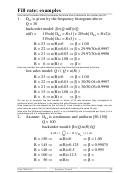 30
30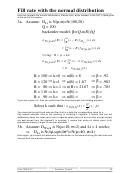 31
31 32
32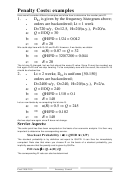 33
33 34
34 35
35 36
36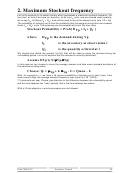 37
37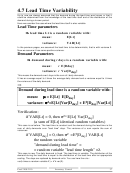 38
38 39
39 40
40Penalty Costs: examples
Here we will consider different examples and show how to determine the reorder point R.
1.
D
is given by the frequency histogram above;
•
Lt
orders are backordered; Lt = 1 week
•
D=720 u/y, O=12.5, H=20/(u.y.), P=20/u.
•
a:
Q = EOQ = 30
b:
Q H/PD = 1/24 = 0.042
R = 20
c:
We could stop here with Q=30 and R=20. However, if we iterate, we obtain:
a:
n( R ) = 0.07
Q = 32
b:
Q H/PD = 320/7200 = 0.044
c:
R = 20
The lot size Q changed, but we find almost the same R value. Since R must be rounded, we
find again R=20 and we stop iterating. To be completely sure with the result, the value R=19
should be checked too.
2.
Lt = 2 weeks; D
is uniform [50-150]
•
Lt
orders are backordered;
•
D=2400 u/y, O=240, H=20/(u.y.), P=2/u.
•
a:
Q = EOQ = 240
b:
Q H/PD = 1/10 = 0.1
c:
R = 140
Let us now iterate by re-computing the lot size Q.
a:
n( R ) = 0.5
Q = 245
b:
Q H/PD = 0.102
c:
R = 140
And we stop here again since R does not change.
Service Aspects:
The order point has thus been computed on the basis of an economic analysis. It is then very
important to determine the corresponding service.
Stockout Probability : α α α α = QH/D × × × × (1/P)
The stockout probability is by definition set equal to QH/PD. It can thus be immediately
computed. Note also that when you choose R on the basis of a stockout probability, you
implicitly assume that the penalty cost is given by QH/Dα.
Fill rate β β β β =(Q-n(R))/Q
The corresponding fill rate can also be determined
Prod 2100-2110
Inventory Control
32
ADVERTISEMENT
0 votes
Related Articles
Related forms


Related Categories
Parent category: Education