Inventory Control Guide Page 26
ADVERTISEMENT
 1
1 2
2 3
3 4
4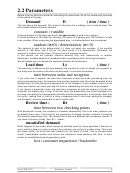 5
5 6
6 7
7 8
8 9
9 10
10 11
11 12
12 13
13 14
14 15
15 16
16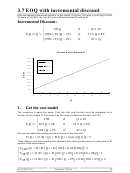 17
17 18
18 19
19 20
20 21
21 22
22 23
23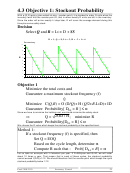 24
24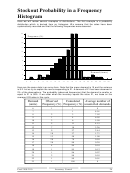 25
25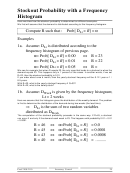 26
26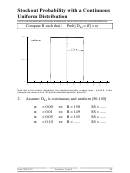 27
27 28
28 29
29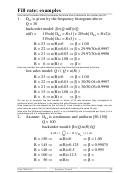 30
30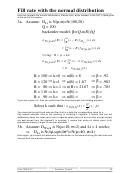 31
31 32
32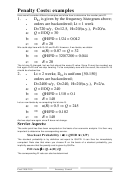 33
33 34
34 35
35 36
36 37
37 38
38 39
39 40
40Stockout Probability with a Frequency
Histogram
Here we show how the stockout probability is determined on different examples.
We first will assume that the demand is distributed according to this frequency histogram.
> R ] = α
Compute R such that : Prob[ D
Lt
Examples
1a. Assume: D
is distributed according to the
Lt
frequency histogram of previous page.
α= Prob[ D
⇔ R = 23
> R ] = 0.00
Lt
α= Prob[ D
⇔ R = 22
> R ] = 0.01
Lt
α= Prob[ D
⇔ R =
> R ] = 0.05
Lt
We see for example that when R equals 22, the only case that leads to a stockout is when the
demand equals 23. This happens only in 1 percent of the cases. In another words, if we set
R=22, then the stockout probability is 0.01.
If you order about once a month, then the yearly stockout frequency will be: 0.12 / year or 1 /
8.5 years.
With R=22, what is the yearly stockout frequency if Q=30?
With R=22, what is the safety stock?
1b. Assume: D
is given by the frequency histogram;
Week
Lt = 2 weeks
Here we assume that the histogram gives the distribution of the weekly demand. The problem
is first to determine the distribution of the demand during two weeks (the lead time).
D
is the sum of two random variables
Lt
distributed as D
Week
The computation of the stockout probability proceeds in the same way. If R=45, a stockout
can occur if and only if the demand each week is 23. This happens with probability 0.01 × 0.01
= 0.0001.
⇔ α= Prob[ D
R = 46
> R ] = 0.0
Lt
⇔ α= Prob[ D
R = 45
> R ] = 0.0001
Lt
⇔ α= Prob[ D
> R ] = 0.0008
R = 43
Lt
⇔ α= Prob[ D
R = 40
> R ] = ..........
Lt
Prod 2100-2110
Inventory Control
25
ADVERTISEMENT
0 votes
Related Articles
Related forms


Related Categories
Parent category: Education