Inventory Control Guide Page 25
ADVERTISEMENT
 1
1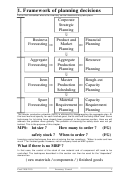 2
2 3
3 4
4 5
5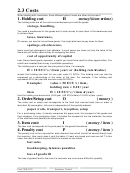 6
6 7
7 8
8 9
9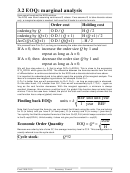 10
10 11
11 12
12 13
13 14
14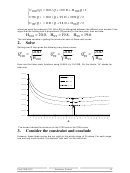 15
15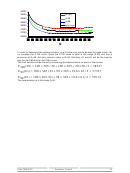 16
16 17
17 18
18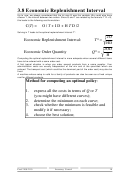 19
19 20
20 21
21 22
22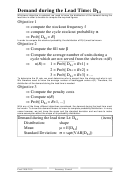 23
23 24
24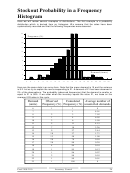 25
25 26
26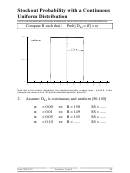 27
27 28
28 29
29 30
30 31
31 32
32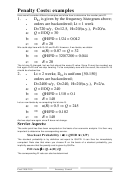 33
33 34
34 35
35 36
36 37
37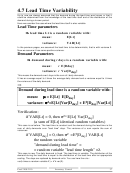 38
38 39
39 40
40Stockout Probability in a Frequency
Histogram
Here we will review several examples of distributions. The first example is a probability
distribution which is derived from an histogram. We assume that the sales have been
systematically recorded and that the following frequencies were observed.
20
Frequence (%)
18
16
14
12
10
8
6
4
Demand (items)
2
0
5
6
7
8
9
10
11
12
13
14
15
16
17
18
19
20
21
22
23
24
25
Here are the same data in an array form. Note that the mean demand is 15 and the variance
is 8.2. Let us try to explain the row corresponding to 21. A demand of 21 has been observed in
2% of the observations. The probability (observed frequencies) that the demand is smaller or
equal to 21 is 98%. If we order when the inventory equals the value 21, we loose on the
average 0.03 sales in this cycle.
Demand
Observed
Cumulated
Average number of
(units)
Frequency (%)
Frequency (%)
unsatisfied demands
6
1
1
9
7
1
8.01
8
2
3
7.02
9
1
4
6.05
10
2
6
5.09
11
5
11
4.15
12
7
18
3.26
13
9
27
2.44
14
10
37
1.71
15
13
50
1.08
16
20
70
0.58
17
20
90
0.28
18
4
94
0.18
19
1
95
0.12
20
1
96
0.07
21
2
98
0.03
22
1
99
0.01
23
1
100
0
Prod 2100-2110
Inventory Control
24
ADVERTISEMENT
0 votes
Related Articles
Related forms


Related Categories
Parent category: Education