Inventory Control Guide Page 37
ADVERTISEMENT
 1
1 2
2 3
3 4
4 5
5 6
6 7
7 8
8 9
9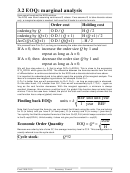 10
10 11
11 12
12 13
13 14
14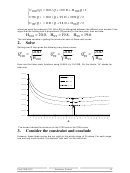 15
15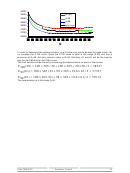 16
16 17
17 18
18 19
19 20
20 21
21 22
22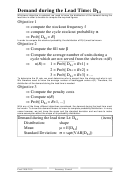 23
23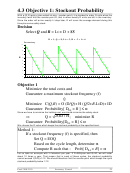 24
24 25
25 26
26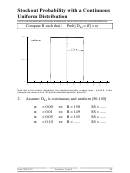 27
27 28
28 29
29 30
30 31
31 32
32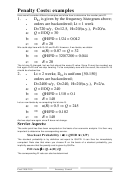 33
33 34
34 35
35 36
36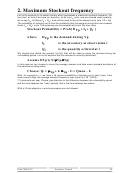 37
37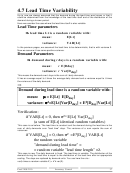 38
38 39
39 40
402. Maximum Stockout frequency
Let us for example try to select a policy which guarantees a maximum stockout frequency. On
the chart, at time 0 we have an inventory, let us say I o units, and we ordered some quantity,
let us say Q o . All these (I o + Q o ) units will be used to serve the demand up to time (13 = Vp).
The probability of stocking out is thus the probability that the demand during this time exceeds
these (I o + Q o ) units. The reasoning can be repeated at time 8. We thus have
Stockout Probability = Prob[ D
> I
+ Q
]
Vp
i
i
where
D
is the demand during Vp
Vp
I
is the inventory at observation i
i
Q
is the quantity ordered at i
i
We should thus define the quantity I(i)+Q(i) that will be used to serve the demand during the
vulnerability period. Let us firs assume that this demand is normally distributed.
is N( µ µ µ µ
, σ σ σ σ
Assume D
)
Vp
Vp
Vp
In this case we can choose to cover the average demand and take some standard deviations of
this demand as safety stock.
= µ µ µ µ
+ k σ σ σ σ
Choose: Q
- I
= Qmax - I
Vp
Vp
i
i
i
With, for example k =1, we have a 16 percent probability of stocking out in each cycle. If we
order every 8 days, the average stockout frequency over a year is 0.16 * 365/8 =
7.2 stockouts per year. Please, pay attention to the difference between the vulnerability period
and the time between two “risky” periods, that is the time between two orders.
With a fill rate objective, a similar procedure can be followed.
Prod 2100-2110
Inventory Control
36
ADVERTISEMENT
0 votes
Related Articles
Related forms


Related Categories
Parent category: Education