Evaluation Plan Guidance Page 57
ADVERTISEMENT
 1
1 2
2 3
3 4
4 5
5 6
6 7
7 8
8 9
9 10
10 11
11 12
12 13
13 14
14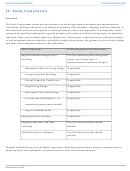 15
15 16
16 17
17 18
18 19
19 20
20 21
21 22
22 23
23 24
24 25
25 26
26 27
27 28
28 29
29 30
30 31
31 32
32 33
33 34
34 35
35 36
36 37
37 38
38 39
39 40
40 41
41 42
42 43
43 44
44 45
45 46
46 47
47 48
48 49
49 50
50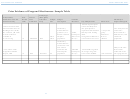 51
51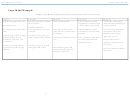 52
52 53
53 54
54 55
55 56
56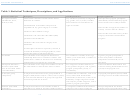 57
57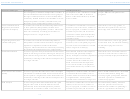 58
58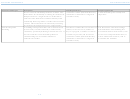 59
59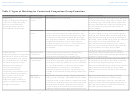 60
60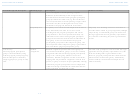 61
61 62
62 63
63 64
64 65
65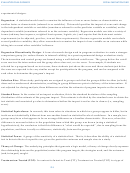 66
66 67
67 68
68EVALUATION PLAN GUIDANCE
SOCIAL INNOVATION FUND
Table 1: Statistical Techniques, Descriptions, and Applications
Statistical Technique
Description
Data Requirements
Sample Application
Descriptive Statistics
These statistics describe variation and the central
Any continuous (numeric) or categorical
What percent of program participants
(distribution, mean,
tendencies of variables.
(e.g., gender, race, or yes/no) variables.
(distribution) learned about the program
median, mode)
Not all statistics are calculable for all
from a friend versus a family member?
The distribution is the number and percent of
types of variables.
respondents in any given category of a variable.
What was the average (mean) number of
visits by a social worker to a family?
The mean is the arithmetic average.
What was the most common way (modal
The median is the value that is the middle (50
th
)
category) that tenants learned about a
percentile of the distribution.
program?
The mode is the most common category of the
distribution.
Use descriptive statistics in exploratory research, to
evaluate the feasibility of testing hypotheses, and to
check assumptions of inferential statistics.
Correlation
An examination of the strength and direction of a
Two continuous variables, such as age,
Is greater program participation as
relationship between two continuous variables. This
income, years of education, or number of
measured by number of modules
statistic shows whether or not the two are statistically
days in program.
completed associated with years of
related, but does not present any causal link.
education?
Chi-Square and Fisher’s
An examination of two categorical variables to assess if
Two categorical variables with two (or
Is there a difference between men and
Exact Test (and related
the combinations of characteristics is due to chance.
more) possible categories, such as gender,
women in seeking mental health services
tests of association within
program participation (yes/no), or
(yes/no) in the program area?
cross tabulations)
race/ethnicity.
T-Test (two group
A comparison of the means of two groups based on a
Variables that are continuous, such as test
Is program participation (yes/no) related
comparison)
single variable (that has only two values, such as yes/no)
scores, indices from mental health
to average score on an intake instrument?
to see if observed differences in groups are larger than
instruments, income levels, or that can be
would be expected due to chance.
divided by a single categorical variable
with only two possible categories, such as
gender or program participation.
ANOVA (and related
A comparison of means of an outcome variable is
A categorical variable with at least three
Does participation in one of three
techniques)
expected to vary based on one other variable (with 3 or
categories, such as types of program
different exercise programs affect young
C.8
ADVERTISEMENT
0 votes
Related Articles
Related forms


Related Categories
Parent category: Education