Evaluation Plan Guidance Page 58
ADVERTISEMENT
 1
1 2
2 3
3 4
4 5
5 6
6 7
7 8
8 9
9 10
10 11
11 12
12 13
13 14
14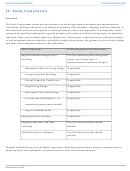 15
15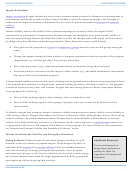 16
16 17
17 18
18 19
19 20
20 21
21 22
22 23
23 24
24 25
25 26
26 27
27 28
28 29
29 30
30 31
31 32
32 33
33 34
34 35
35 36
36 37
37 38
38 39
39 40
40 41
41 42
42 43
43 44
44 45
45 46
46 47
47 48
48 49
49 50
50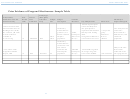 51
51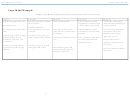 52
52 53
53 54
54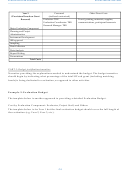 55
55 56
56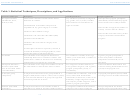 57
57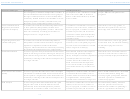 58
58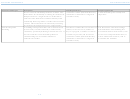 59
59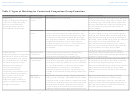 60
60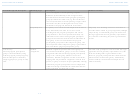 61
61 62
62 63
63 64
64 65
65 66
66 67
67 68
68EVALUATION PLAN GUIDANCE
SOCIAL INNOVATION FUND
Statistical Technique
Description
Data Requirements
Sample Application
more categories) or based on multiple other variables. It
participated in, and a continuous variable,
people’s BMI after completion of the
is used to determine if the means the various groups of
such as test scores, BMI, or income in
programs?
the target variable (based on a second variable) differ
dollars. Other model forms may include
statistically. Related models such as MANOVA can use
more variables.
multiple dependent variables, while ANCOVA (and
MANCOVA) use multiple independent covariates.
Linear and Hierarchical
A model used to examine the relationship between one
A continuous variable that is an outcome
What factors, such as age, gender, or
Regression (and related
or more predictive (independent) variables and a
of interest, such as test scores, number of
education level, predict test scores on a
regression techniques)
continuous outcome (dependent) variable. This model
days in a program, or number of visits to
knowledge exam of health behaviors?
allows for statistically accounting for the effects of
a health care provider, and at least one
multiple factors on a single outcome.
continuous variable (and the model may
include more continuous or categorical
variables as well).
Logistic Regression (and
A model used to examine the relationship between
A categorical variable that is an outcome
Assess what factors, such as age, gender,
related techniques)
independent variables and a dichotomous categorical
of interest, such as completed program or
or education level, are related to attending
dependent or dependent variable with limited
not, and at least one continuous variable
an afterschool program versus not
categories. This model allows for statistically accounting
and/or categorical variable(s)).
attending.
for the effects of multiple factors on a single outcome.
Fixed Effects Models
A form of regression analysis that holds constant factors
Data collected from the same subjects at
What factors were associated with a net
which do not change over time, allowing for analysis of
least twice (and preferably multiple
increase in income levels over time for a
factors that do change over time. This model allows for
times). Examples of outcomes (dependent
group of unstably employed individuals?
statistically accounting for the effects of multiple factors
variables) include test scores from
on a single outcome.
students taken in three different years,
blood cell counts taken multiple times
across several months, or employment
status documented every month for one
year.
Hierarchical Linear Models
A form of regression that takes into account the unique
Independent variables within a level that
How well did students do on a test within
(HLM)
contribution of variables within and across hierarchical
are nested within one another, such as
an entire school district, taking into
levels to predict a single outcome. This model allows for
students within classrooms within schools
account program participation, different
statistically accounting for the effects of multiple factors
or neighborhoods. The dependent
classroom experiences, and different
on a single outcome.
variable can be continuous or categorical.
school level programs?
Path Analysis
A series of regression models formulated into a path
Continuous variables that are outcomes of
Given that family stability, education
diagram that is used to describe both the size and
interest, such as test scores, number of
level, and previous level of service
directionality of the relationship between predictor
days in a program, or number of visits to
utilization all contribute to predicting
a
variables and an outcome variable. It is used to test
a health care provider, and at least one
score on a psychometric instrument,
C.9
ADVERTISEMENT
0 votes
Related Articles
Related forms


Related Categories
Parent category: Education