State Performance Plan 2005-2012 - Part B - Arkansas Department Of Education Page 196
ADVERTISEMENT
 1
1  2
2  3
3  4
4  5
5  6
6  7
7  8
8  9
9  10
10  11
11  12
12  13
13  14
14  15
15  16
16  17
17  18
18  19
19  20
20  21
21  22
22  23
23  24
24  25
25  26
26  27
27  28
28  29
29  30
30  31
31  32
32  33
33  34
34  35
35  36
36  37
37  38
38  39
39  40
40  41
41  42
42  43
43 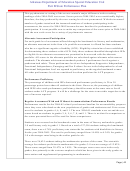 44
44  45
45  46
46  47
47  48
48  49
49  50
50  51
51  52
52  53
53  54
54  55
55  56
56  57
57  58
58  59
59  60
60  61
61  62
62  63
63  64
64  65
65  66
66  67
67  68
68  69
69  70
70  71
71  72
72  73
73  74
74  75
75  76
76  77
77  78
78  79
79  80
80 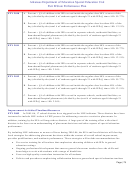 81
81  82
82  83
83  84
84 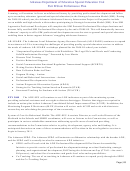 85
85  86
86  87
87  88
88  89
89  90
90  91
91  92
92  93
93  94
94  95
95  96
96  97
97  98
98  99
99  100
100  101
101  102
102  103
103  104
104  105
105  106
106  107
107  108
108  109
109  110
110  111
111  112
112  113
113  114
114  115
115  116
116  117
117  118
118  119
119  120
120  121
121  122
122  123
123  124
124  125
125  126
126  127
127  128
128  129
129  130
130  131
131  132
132  133
133  134
134  135
135  136
136  137
137  138
138  139
139  140
140  141
141  142
142  143
143  144
144  145
145  146
146  147
147  148
148  149
149  150
150  151
151  152
152  153
153  154
154  155
155  156
156  157
157  158
158  159
159  160
160  161
161  162
162  163
163  164
164  165
165  166
166  167
167  168
168  169
169  170
170  171
171  172
172  173
173  174
174  175
175  176
176  177
177  178
178  179
179  180
180  181
181  182
182  183
183  184
184  185
185  186
186  187
187  188
188  189
189  190
190  191
191  192
192 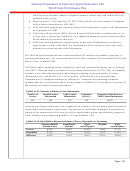 193
193 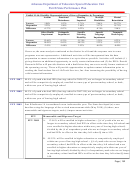 194
194  195
195  196
196  197
197  198
198  199
199  200
200  201
201  202
202  203
203  204
204 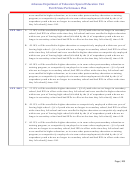 205
205  206
206 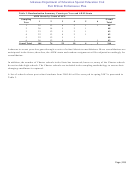 207
207  208
208  209
209  210
210  211
211  212
212  213
213  214
214  215
215  216
216  217
217  218
218  219
219  220
220  221
221  222
222  223
223  224
224  225
225  226
226  227
227  228
228  229
229  230
230  231
231  232
232  233
233  234
234  235
235  236
236  237
237  238
238  239
239  240
240  241
241  242
242  243
243  244
244  245
245  246
246  247
247  248
248  249
249  250
250  251
251  252
252  253
253  254
254  255
255  256
256  257
257  258
258  259
259  260
260  261
261  262
262  263
263  264
264  265
265  266
266  267
267  268
268  269
269  270
270  271
271  272
272  273
273  274
274  275
275  276
276  277
277 Arkansas Department of Education Special Education Unit
Part B State Performance Plan
Of the five (5) categories presented above, the first three (3) are used to calculate the Indicator
measurements. The calculation with baseline data is presented below.
A: (31/241)*100 = 12.86%
B: ((31+86)/241)*100 = 48.55
C: ((31+86+11)/241)*100 = 59.34%
LifeTrack began contacting former students in May and continued with phone surveys through
July 2010. Although steps were taken to verify contact information, 42.8% (369) of telephone
numbers were either disconnected or had changed resulting in wrong numbers. Contact
information was valid for 250 or 32.052% of leavers. LifeTrack Services exceeded their
th
contractual commitment of 5 telephone attempts by making a 6
attempt to all remaining
telephone numbers that were not disconnected or wrong numbers. Exhibit I-14.2 provides an
overview of the outcome of student contact information.
Exhibit I-14.2: Outcome of Student Contact Information
Number of
Invalid Contact
Valid Contact
Completed
Response Rate Based on
Response Rate Based
Leavers
Information
Information
Survey’s
Valid Contact Information
on Number of Leaver
780
530
250
241
96.40%
30.90%
An analysis of representativeness was conducted, by the IDEA Data & Research Office, on
the characteristics of disability type, ethnicity, and dropout on the respondent group to
determine whether the youth who responded to the surveys were similar to or different from
the total population of youth with an IEP who exited school in 2008-09.
A significant difference between the Respondent Group and the Target Leaver Group is
measured by a difference of ±3%. The rate of difference was adopted from the National Post-
School Outcomes Center calculator. The negative differences indicate an under-
representativeness of the group and positive differences indicate over-representativeness.
The analysis revealed that responders were under-represented in the racial group Black and
were over-represented of the racial group white. Disability representativeness is relatively
similar to the composition of leavers over all for racial/ethnic groups and disability
categories. These findings are presented in Exhibit I-14.3, Exhibit I-14.4, and Exhibit I-14.5
and the categories with a ±3% difference are in bold.
Exhibit I-14.3: Racial/Ethnic Representativeness of Survey Responders by Percentage
American
Asian/Pacific
Black
Hispanic
White
Indian/ Alaskan
Islander
(non-Hispanic)
(non-Hispanic)
Native
0.13%
1.15%
26.79%
6.28%
65.64%
Leavers
0.00%
1.66%
19.92%
4.56%
73.86%
Responders
-0.13%
0.51%
-6.88%
-1.72%
Difference
8.22%
Page | 194
ADVERTISEMENT
0 votes
Related Articles
Related forms


 Professional Development Request For National Board Certified Teachers - Arkansas Department Of Education
Legal
Professional Development Request For National Board Certified Teachers - Arkansas Department Of Education
Legal
 Professional Development Request For National Board Certified Teacher Candidates - Arkansas Department Of Education
Legal
Professional Development Request For National Board Certified Teacher Candidates - Arkansas Department Of Education
Legal

")


Related Categories
Parent category: Legal