State Performance Plan 2005-2012 - Part B - Arkansas Department Of Education Page 25
ADVERTISEMENT
 1
1  2
2  3
3  4
4  5
5  6
6  7
7  8
8  9
9  10
10  11
11  12
12  13
13  14
14  15
15  16
16  17
17  18
18  19
19  20
20  21
21  22
22  23
23  24
24  25
25  26
26  27
27  28
28  29
29  30
30  31
31  32
32  33
33  34
34  35
35  36
36  37
37  38
38  39
39  40
40  41
41  42
42  43
43  44
44 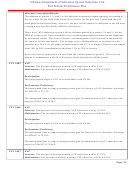 45
45  46
46 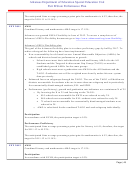 47
47  48
48  49
49  50
50  51
51  52
52  53
53  54
54  55
55  56
56  57
57  58
58  59
59 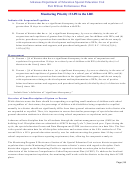 60
60  61
61  62
62  63
63 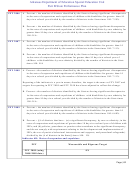 64
64  65
65  66
66 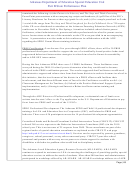 67
67 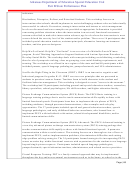 68
68 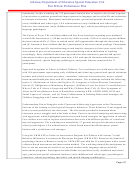 69
69  70
70  71
71  72
72  73
73  74
74  75
75  76
76  77
77  78
78  79
79  80
80 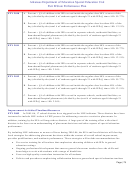 81
81 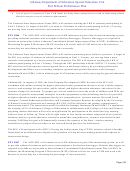 82
82 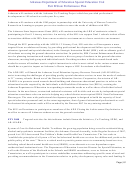 83
83  84
84 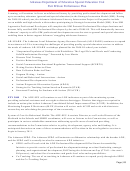 85
85 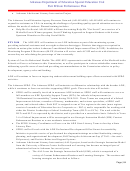 86
86 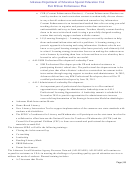 87
87 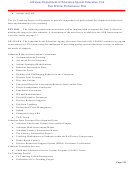 88
88  89
89  90
90 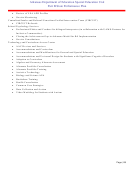 91
91 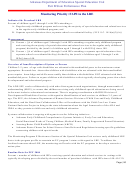 92
92 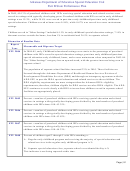 93
93 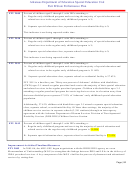 94
94  95
95  96
96 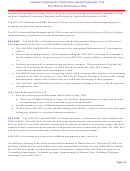 97
97  98
98  99
99  100
100  101
101  102
102  103
103 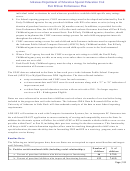 104
104  105
105  106
106 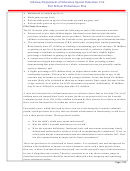 107
107  108
108  109
109  110
110  111
111  112
112  113
113  114
114  115
115  116
116  117
117  118
118  119
119  120
120  121
121  122
122  123
123  124
124  125
125  126
126  127
127  128
128  129
129  130
130  131
131  132
132  133
133  134
134  135
135  136
136  137
137  138
138  139
139  140
140  141
141  142
142  143
143  144
144  145
145  146
146  147
147  148
148 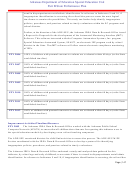 149
149 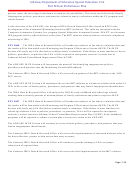 150
150 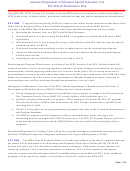 151
151  152
152  153
153  154
154  155
155 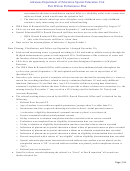 156
156  157
157  158
158  159
159  160
160  161
161  162
162  163
163  164
164  165
165  166
166 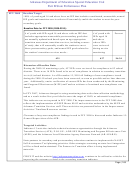 167
167  168
168 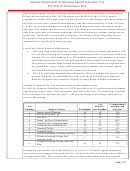 169
169  170
170  171
171  172
172  173
173 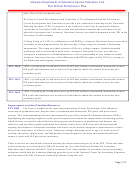 174
174 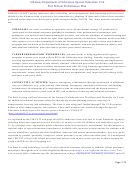 175
175  176
176 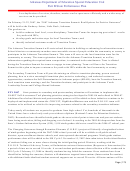 177
177  178
178  179
179  180
180  181
181  182
182  183
183  184
184  185
185  186
186  187
187  188
188  189
189  190
190  191
191  192
192 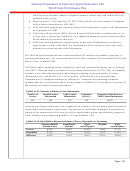 193
193 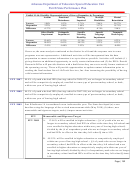 194
194  195
195 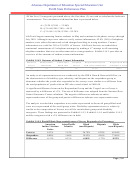 196
196  197
197 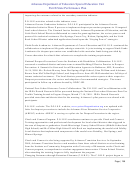 198
198  199
199  200
200  201
201  202
202  203
203 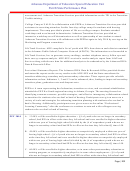 204
204 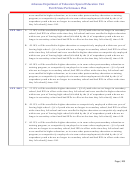 205
205  206
206 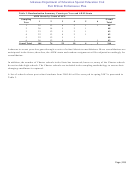 207
207  208
208  209
209  210
210  211
211  212
212  213
213  214
214  215
215  216
216  217
217  218
218  219
219  220
220  221
221  222
222  223
223  224
224  225
225  226
226  227
227  228
228  229
229  230
230  231
231  232
232  233
233  234
234  235
235 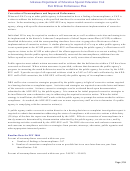 236
236  237
237 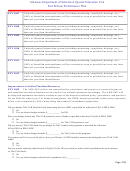 238
238  239
239 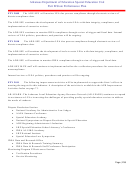 240
240  241
241  242
242  243
243  244
244  245
245  246
246  247
247  248
248  249
249  250
250  251
251  252
252  253
253  254
254  255
255  256
256  257
257  258
258  259
259  260
260  261
261  262
262  263
263  264
264  265
265  266
266  267
267  268
268  269
269  270
270  271
271  272
272  273
273  274
274  275
275  276
276  277
277 Arkansas Department of Education Special Education Unit
Part B State Performance Plan
(a) If the number of dropouts for grade seven was 0 and the October 1 enrollment was 51, the 7th grade
dropout rate is 0/51 = .00 or 0.00%.
(b) If the number of dropouts for grade eight was 3 and the October 1 enrollment was 63, the 8th grade
dropout rate is 3/63 = .0476 or 4.76%.
(c) If the number of dropouts for grade nine was 1 and the October 1 enrollment was 56, the 9th grade
dropout rate is 1/56 = .0179 or 1.79%.
(d) If the number of dropouts for grade 10 was 2 and the October 1 enrollment was 60, the 10th grade
dropout rate is 2/60 = .0333 or 3.33%.
(e) If the number of dropouts for grade 11 was 4 and the October 1 enrollment was 54, the 11th grade
dropout rate is 4/54 = .0741 or 7.41%.
(f) If the number of dropouts for grade 12 was 3 and the October 1 enrollment was 57, the 12th grade
dropout rate is 3/57 = .0526 or 5.26%.
Overall the rate would be 10/284 = .0352 or 3.52%
Baseline Data for FFY 2004
In 2005, an average of 3.32% of students with IEPs age 14-21 dropped out of high school as compared to
4.59% of all students grade 9-12 resulting in a mean difference of –1.27 percentage points
(3.32% - 4.59%). The analysis further revealed that the special education dropout rate is 27.67% lower than
the dropout rate for all students. Additionally, 9 districts (3.5%) triggered on the dropout monitoring priority
indicator; thus, identifying them for possible monitoring during the 2005-06 school year.
Discussion of Baseline Data
FFY 2004
Measurable and Rigorous Target
In 2004, the Arkansas General Assembly passed a new dropout formula to insure that students
moving from one district to another would not be inadvertently counted as a dropout. This
change in tracking and reporting procedures continues to show the historical lower special
education dropout rate when compared to all students in grades 9-12.
Using a moving average based on the past four years (2002 - 2005) of data, Arkansas
FFY 2005
anticipates the percentage of youth with IEPs dropping out of school to decline from 3.32 to
2.70%.
In 2007, Arkansas anticipates the percentage of youth with IEPs dropping out of school to
FFY 2006
slightly increase from 2.70 to 2.83%.
In 2008, Arkansas anticipates the percentage of youth with IEPs dropping out of school to
FFY 2007
slightly increase from 2.83 to 2.87%.
The target for the percent of youth with IEPs dropping out of high school is 4.28%.
FFY 2008
FFY 2008 reporting represents a new baseline for the indicator due to the changes in the
measurement requiring the use of ESEA reported data. For 2008-09 the alignment matches the
requirements of the Consolidated State Performance Report (CSPR). The CSPR uses the
Common Core of Data (CCD) required dropout data for students in grades 7-12, which reports
one year in arrears. The reporting requirements differ from previous IDEA reporting, which
included the most current school year and students ages 14-21, which equated to grades 9-12.
Page | 23
ADVERTISEMENT
0 votes
Related Articles
Related forms


 Professional Development Request For National Board Certified Teachers - Arkansas Department Of Education
Legal
Professional Development Request For National Board Certified Teachers - Arkansas Department Of Education
Legal
 Professional Development Request For National Board Certified Teacher Candidates - Arkansas Department Of Education
Legal
Professional Development Request For National Board Certified Teacher Candidates - Arkansas Department Of Education
Legal

")


Related Categories
Parent category: Legal