State Performance Plan 2005-2012 - Part B - Arkansas Department Of Education Page 8
ADVERTISEMENT
 1
1  2
2  3
3  4
4  5
5  6
6  7
7  8
8  9
9  10
10  11
11  12
12  13
13  14
14  15
15  16
16  17
17  18
18  19
19  20
20  21
21  22
22  23
23  24
24  25
25  26
26  27
27  28
28  29
29  30
30  31
31  32
32  33
33  34
34  35
35  36
36  37
37  38
38  39
39  40
40  41
41  42
42  43
43  44
44  45
45  46
46  47
47  48
48  49
49  50
50  51
51  52
52  53
53  54
54  55
55  56
56  57
57  58
58  59
59  60
60  61
61  62
62  63
63  64
64  65
65  66
66  67
67  68
68  69
69  70
70  71
71  72
72  73
73  74
74  75
75  76
76  77
77  78
78  79
79  80
80  81
81  82
82  83
83  84
84  85
85  86
86  87
87  88
88  89
89  90
90  91
91  92
92  93
93  94
94  95
95  96
96  97
97  98
98  99
99  100
100  101
101  102
102  103
103  104
104  105
105  106
106  107
107  108
108  109
109  110
110  111
111  112
112  113
113  114
114  115
115  116
116  117
117  118
118  119
119  120
120  121
121  122
122  123
123  124
124  125
125  126
126  127
127  128
128  129
129  130
130  131
131  132
132  133
133  134
134  135
135  136
136  137
137  138
138  139
139  140
140  141
141  142
142  143
143  144
144  145
145  146
146  147
147  148
148  149
149  150
150  151
151  152
152  153
153  154
154  155
155  156
156  157
157  158
158  159
159  160
160  161
161  162
162  163
163  164
164  165
165  166
166  167
167  168
168  169
169  170
170  171
171  172
172  173
173  174
174  175
175  176
176  177
177  178
178  179
179  180
180  181
181  182
182  183
183  184
184  185
185  186
186  187
187  188
188  189
189  190
190  191
191  192
192  193
193 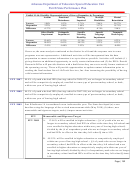 194
194  195
195 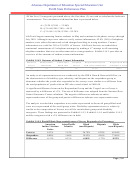 196
196  197
197  198
198  199
199  200
200  201
201  202
202  203
203  204
204  205
205  206
206  207
207  208
208  209
209  210
210  211
211  212
212  213
213  214
214  215
215  216
216  217
217  218
218  219
219  220
220  221
221  222
222  223
223  224
224  225
225  226
226  227
227  228
228  229
229  230
230  231
231  232
232  233
233  234
234  235
235  236
236  237
237  238
238  239
239  240
240  241
241  242
242  243
243  244
244  245
245  246
246  247
247  248
248  249
249  250
250  251
251  252
252  253
253  254
254  255
255  256
256  257
257  258
258  259
259  260
260  261
261  262
262  263
263  264
264  265
265  266
266  267
267  268
268  269
269  270
270  271
271  272
272  273
273  274
274  275
275  276
276  277
277 Arkansas Department of Education Special Education Unit
Part B State Performance Plan
conform to local district policy and reflect state frameworks through course sequencing and career
course concentrations where appropriate.
Local school districts may require additional units for graduation beyond the sixteen (16) Core and the
six (6) career focus units. These may be in academic and/or technical areas. All the Core and career
focus units must total at least twenty-two (22) units to graduate.
A unit of credit shall be defined as the credit given for a course, which meets for a minimum of 120 clock
hours. A minimum average six-hour day or minimum 30-hour week is required.
The Monitoring/Program Effectiveness Section of the Special Education Unit reviews district single year
event graduation data via the Monitoring Profiles to ascertain a district’s status with regard to graduation.
Each district that triggers on the Monitoring Profiles is required to include an action plan in the district's
submission of the Arkansas Comprehensive School Improvement Plan (ACSIP). To address the localized
concerns about graduation, the monitoring staff works with the districts to develop their ACSIP plans.
Baseline Data for FFY 2004
In 2005, Arkansas school districts graduated 93 % of 12th grade students. For youth with IEPs, the
graduation rate with a regular diploma under Smart Core or Core was 88%.
The methodology used to identify districts for monitoring revealed that 91.54% of districts met or exceeded
the State special education benchmark for graduation. Seven percent of districts fell between the State
benchmark and trigger value indicating a risk for triggering in the future and two percent or six districts
were identified for possible monitoring during 2005-06 school year.
Discussion of Baseline Data
Report
Measurable and Rigorous Target
Year
The graduation rate for students receiving special education services has increased over the
FFY 2004
past four years by 40% from 63% in 2002 to 88% in 2005. During the same time reference,
all 12th grade graduation rates have remained relatively constant with less than a 1 % change,
from 92.7% in 2002 to 93.1% in 2005.
The improvement reflects (1) the inclusiveness of a regular diploma-Smart Core and Core-for
youth with and without disabilities; (2) the work of secondary transition specialists working
with school districts to help keep youth with IEPs in school through student-driven transition
planning; (3) better data collection methods and ongoing training with districts to address data
submission protocols and data review; and (4) usage of the same methodology for calculating
the graduation rate for youth with disabilities as for youth without disabilities.
To identify school districts that are graduating a significant difference of students in general
education than students receiving special education services, the ADE-SEU examined the
12th grade graduation rate for both groups. The data for this goal is retrieved from the
Arkansas Public School Computer Network (APSCN). The graduation rate is calculated by
taking the number of youth with IEPs who graduated in a given year divided by the official
12th grad enrollment number of youth with IEPs, adjusted for transferring students. The same
methodology is used to calculate the general education graduation rate. Districts may be
Page | 6
ADVERTISEMENT
0 votes
Related Articles
Related forms
Related Categories
Parent category: Legal


