What-If Analysis, Charting, And Working With Large Worksheets Page 2
ADVERTISEMENT
 1
1 2
2 3
3 4
4 5
5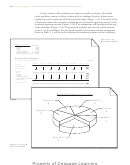 6
6 7
7 8
8 9
9 10
10 11
11 12
12 13
13 14
14 15
15 16
16 17
17 18
18 19
19 20
20 21
21 22
22 23
23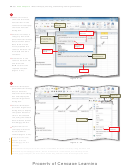 24
24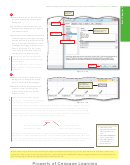 25
25 26
26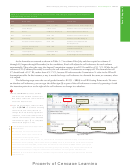 27
27 28
28 29
29 30
30 31
31 32
32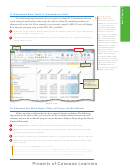 33
33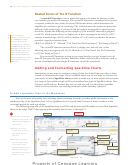 34
34 35
35 36
36 37
37 38
38 39
39 40
40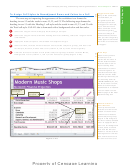 41
41 42
42 43
43 44
44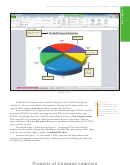 45
45 46
46 47
47 48
48 49
49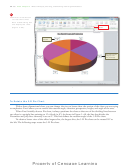 50
50 51
51 52
52 53
53 54
54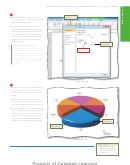 55
55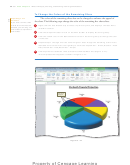 56
56 57
57 58
58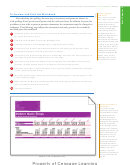 59
59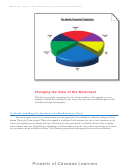 60
60 61
61 62
62 63
63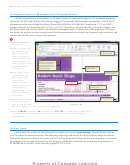 64
64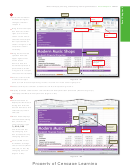 65
65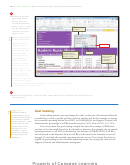 66
66 67
67 68
68 69
69 70
70 71
71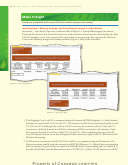 72
72 73
73 74
74 75
75 76
76 77
77 78
78 79
79 80
80 81
81 82
82 83
83 84
84 85
85 86
86 87
87Microsoft Excel 2010
3
What-If Analysis,
Charting, and Working
with Large Worksheets
Introduction
Worksheets normally are much larger than those created in the previous chapters,
often extending beyond the size of the Excel window. Because you cannot see the entire
worksheet on the screen at one time, working with a large worksheet sometimes can be
frustrating. This chapter introduces several Excel commands that allow you to control
what is displayed on the screen so that you can view critical parts of a large worksheet at
one time. One command allows you to freeze rows and columns so that Excel always dis-
plays them on the screen. Another command splits the worksheet into separate window-
panes so that you can view different parts of a worksheet on the screen at one time.
When you set up a worksheet, you should use cell references in formulas whenever
possible, rather than constant values. The use of a cell reference allows you to change a value
in multiple formulas by changing the value in a single cell. The cell references in a formula
are called assumptions. Assumptions are values in cells that you can change to determine new
values for formulas. This chapter emphasizes the use of assumptions and shows how to use
Excel to answer what-if questions, such as what happens to the six-month operating income if
you decrease the marketing expenses assumption by 3 percent? Being able to analyze quickly
the effect of changing values in a worksheet is an important skill in making business decisions.
This chapter also introduces you to techniques that will enhance your ability to
create worksheets and draw charts. From your work in Chapter 1, you are aware of how
easily you can create charts. This chapter covers additional charting techniques that allow
you to convey a message in a dramatic pictorial fashion, such as Sparkline charts and an
exploded 3-D pie chart. This chapter also covers other methods for entering values in cells,
such as allowing Excel to enter values for you based on a pattern of values that you create,
and formatting these values. In addition, you will learn how to use absolute cell references
and how to use the IF function to assign a value to a cell based on a logical test.
Project — Financial Projection Worksheet
with What-If Analysis and Chart
The project in the chapter follows proper design guidelines and uses Excel to create
the worksheet and pie chart shown in Figures 3–1a and 3–1b. Modern Music Shops
operates several stores that sell and service musical instruments. Each June and December,
the director of fi nance and accounting submits a plan to the management team to show
projected monthly sales revenues, costs of goods sold, gross margin, expenses, and operating
income for the next six months. The director requires an easy-to-read worksheet that
shows fi nancial projections for the next six months. The worksheet should allow for quick
analysis if projections for certain numbers change, such as the percentage of expenses
allocated to marketing. In addition, a 3-D pie chart is required that shows the projected
operating income contribution for each of the six months.
EX 138
ADVERTISEMENT
0 votes
Related Articles
Related forms


Related Categories
Parent category: Education