What-If Analysis, Charting, And Working With Large Worksheets Page 35
ADVERTISEMENT
 1
1 2
2 3
3 4
4 5
5 6
6 7
7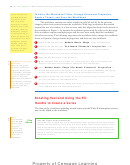 8
8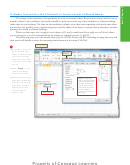 9
9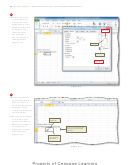 10
10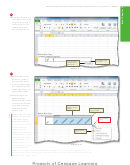 11
11 12
12 13
13 14
14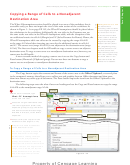 15
15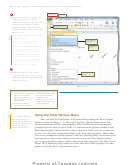 16
16 17
17 18
18 19
19 20
20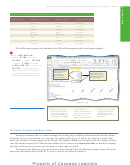 21
21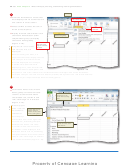 22
22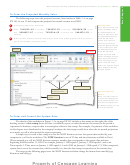 23
23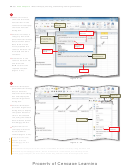 24
24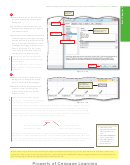 25
25 26
26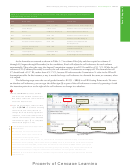 27
27 28
28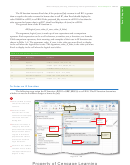 29
29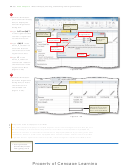 30
30 31
31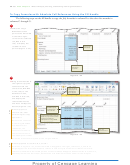 32
32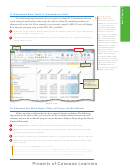 33
33 34
34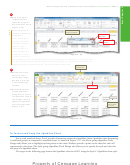 35
35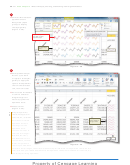 36
36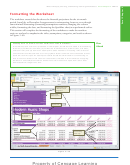 37
37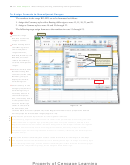 38
38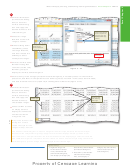 39
39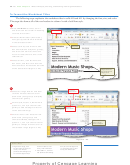 40
40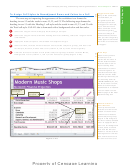 41
41 42
42 43
43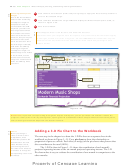 44
44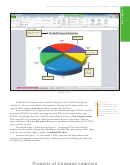 45
45 46
46 47
47 48
48 49
49 50
50 51
51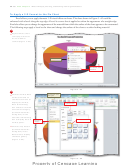 52
52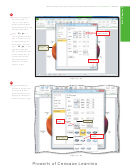 53
53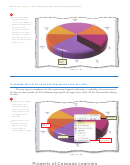 54
54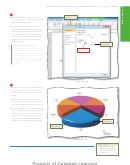 55
55 56
56 57
57 58
58 59
59 60
60 61
61 62
62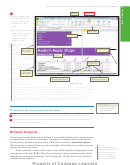 63
63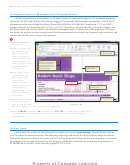 64
64 65
65 66
66 67
67 68
68 69
69 70
70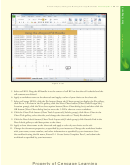 71
71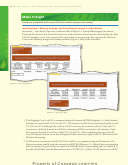 72
72 73
73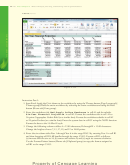 74
74 75
75 76
76 77
77 78
78 79
79 80
80 81
81 82
82 83
83 84
84 85
85 86
86 87
87What-If Analysis, Charting, and Working with Large Worksheets
Excel Chapter 3
EX 171
2
•
Drag through the
range B13:G13 to
select the range. Do
not release the mouse
(Figure 3 – 36).
What happened to
Create Sparklines
dialog box collapsed
the Create Sparklines
Expand Dialog
dialog box?
Box button
When a dialog box
includes a Collapse
range B13:G13
selected
Dialog Box button
(Figure 3 – 35),
selecting cells or a
range collapses the
dialog box so that
Figure 3– 36
only the current text
box is displayed. Once the selection is made, the dialog box expands back to its original size.
You also can click the Collapse Dialog Box button to make your selection and then click the
Expand Dialog Box button (Figure 3–36) to expand the dialog box.
Sparkline Tools
contextual tab
3
•
Release the mouse
button to insert
the selected range,
B13:G13 in this case,
in the Data Range
text box.
More button
•
Click the OK button
(Create Sparklines
dialog box) to insert a
Line Sparkline chart in
the selected cell and
display the Sparkline
Line Sparkline
Tools contextual tab
chart inserted
in cell I13
(Figure 3 – 37).
Figure 3– 37
To Format and Copy the Sparkline Chart
Just as with standard charts, Excel provides formatting options for Sparkline charts. Sparkline chart formatting
is restricted greatly as compared to standard charts. As shown in Figure 3–37, the Show group (Sparkline Tools
Design tab) allows you to highlight various points in the chart. Markers provide a point on the chart for each cell
represented in the chart. The Style group (Sparkline Tools Design tab) allows you to specify the style and color for
the parts of a Sparkline chart.
The steps on the following page format the Sparkline chart in cell I13 using the Style 13 Sparkline chart style.
ADVERTISEMENT
0 votes
Related Articles
Related forms


Related Categories
Parent category: Education