What-If Analysis, Charting, And Working With Large Worksheets Page 54
ADVERTISEMENT
 1
1 2
2 3
3 4
4 5
5 6
6 7
7 8
8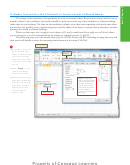 9
9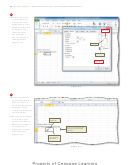 10
10 11
11 12
12 13
13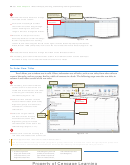 14
14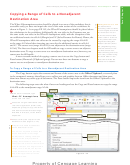 15
15 16
16 17
17 18
18 19
19 20
20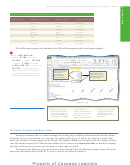 21
21 22
22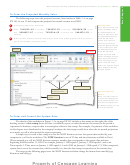 23
23 24
24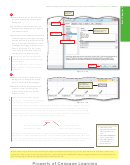 25
25 26
26 27
27 28
28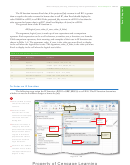 29
29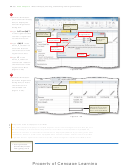 30
30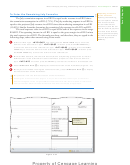 31
31 32
32 33
33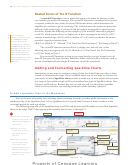 34
34 35
35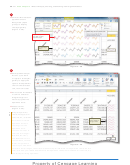 36
36 37
37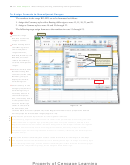 38
38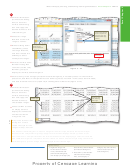 39
39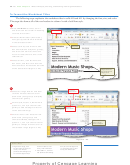 40
40 41
41 42
42 43
43 44
44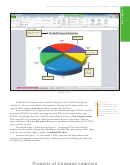 45
45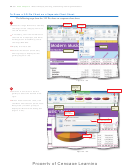 46
46 47
47 48
48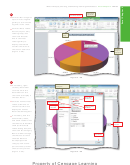 49
49 50
50 51
51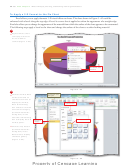 52
52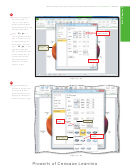 53
53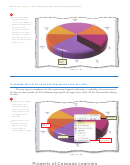 54
54 55
55 56
56 57
57 58
58 59
59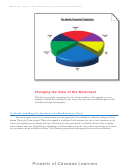 60
60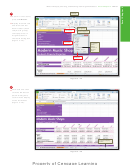 61
61 62
62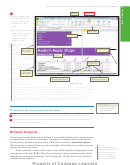 63
63 64
64 65
65 66
66 67
67 68
68 69
69 70
70 71
71 72
72 73
73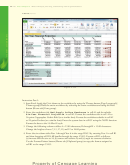 74
74 75
75 76
76 77
77 78
78 79
79 80
80 81
81 82
82 83
83 84
84 85
85 86
86 87
87EX 190
Excel Chapter 3
What-If Analysis, Charting, and Working with Large Worksheets
5
•
Click the Soft Edge
button (column 2,
row 2) in the Material
gallery and then click
the Close button
(Format Data Series
dialog box) to apply
the desired material
and close the Format
Data Series dialog box
(Figure 3 – 67).
soft edge is
displayed
on chart
Figure 3 – 67
To Explode the 3-D Pie Chart and Change the Color of a Slice
The next step is to emphasize the slice representing August by offsetting, or exploding, it from the rest of
the slices so that it stands out. The following steps explode the largest slice of the 3-D Pie chart and then change
its color.
1
•
Click the slice labeled
August twice (do
not double-click) to
select only one slice
of the 3-D Pie chart,
the August slice in
this case.
Mini toolbar
•
Right-click the slice
labeled August to
August slice
display a shortcut
selected
menu and Mini
toolbar (Figure 3 –68).
shortcut menu
Format Data
Point command
Figure 3 – 68
ADVERTISEMENT
0 votes
Related Articles
Related forms


Related Categories
Parent category: Education