What-If Analysis, Charting, And Working With Large Worksheets Page 64
ADVERTISEMENT
 1
1 2
2 3
3 4
4 5
5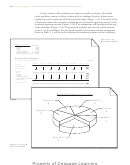 6
6 7
7 8
8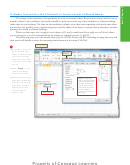 9
9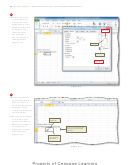 10
10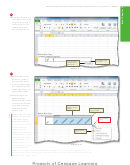 11
11 12
12 13
13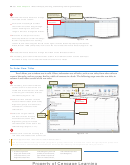 14
14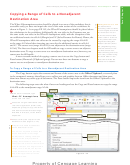 15
15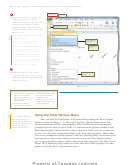 16
16 17
17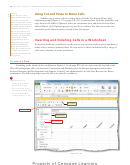 18
18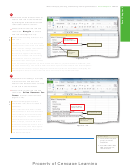 19
19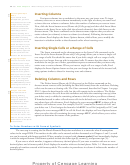 20
20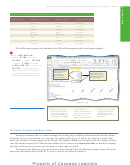 21
21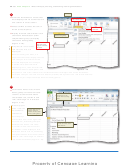 22
22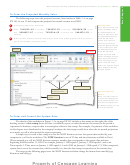 23
23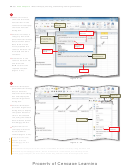 24
24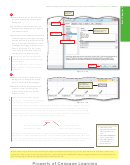 25
25 26
26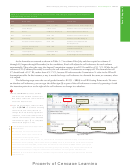 27
27 28
28 29
29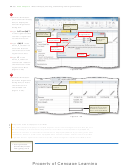 30
30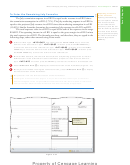 31
31 32
32 33
33 34
34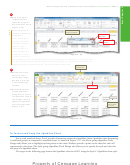 35
35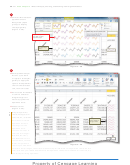 36
36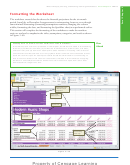 37
37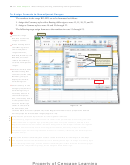 38
38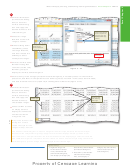 39
39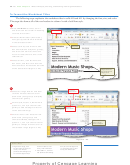 40
40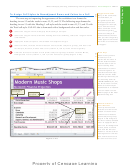 41
41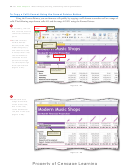 42
42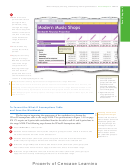 43
43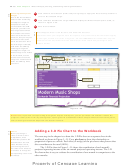 44
44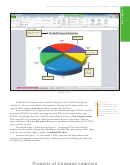 45
45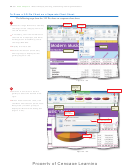 46
46 47
47 48
48 49
49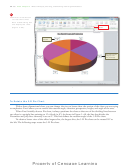 50
50 51
51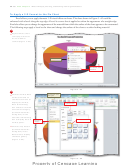 52
52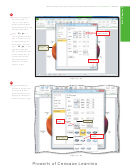 53
53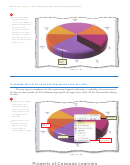 54
54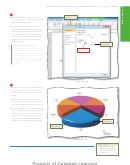 55
55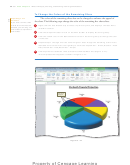 56
56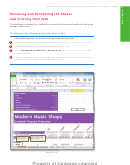 57
57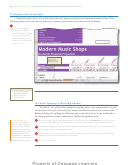 58
58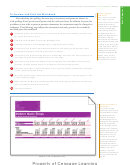 59
59 60
60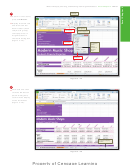 61
61 62
62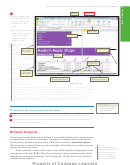 63
63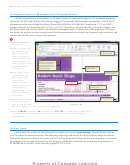 64
64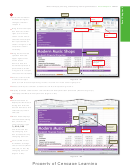 65
65 66
66 67
67 68
68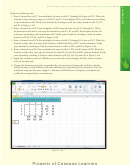 69
69 70
70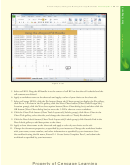 71
71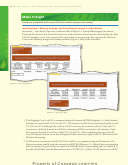 72
72 73
73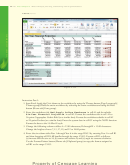 74
74 75
75 76
76 77
77 78
78 79
79 80
80 81
81 82
82 83
83 84
84 85
85 86
86 87
87EX 200
Excel Chapter 3
What-If Analysis, Charting, and Working with Large Worksheets
To Analyze Data in a Worksheet by Changing Values
A what-if question for the worksheet in Chapter 3 might be what would happen to the six-month operating
income in cell H25 if the Bonus, Commission, Support, General, and Administrative assumptions in the What-If
Assumptions table were changed as follows: Bonus $200,000.00 to $150,000.00; Commission 5.75% to 4.00%;
Support, General, and Administrative 18.75% to 15.75%? To answer a question like this, you need to change only
the fi rst, second, and seventh values in the What-If Assumptions table, as shown in the following steps. The steps
also divide the window into two vertical panes. Excel instantaneously recalculates the formulas in the worksheet and
redraws the 3-D Pie chart to answer the question.
1
+
•
Press
to
CTRL
HOME
select cell A1.
•
Drag the vertical split
box from the lower-
original location of
right corner of the
horizontal split box
screen to the left so
that the vertical split
bar is positioned as
changes to assumptions
affect projected monthly
shown in Figure 3– 80
expenses and operating
incomes, which in turn
to split the screen
affect projected six-month
current location of
vertically.
operating income
vertical split box
current location of
•
Drag the horizontal
horizontal split box
split box from the
upper-right corner
of the screen
vertical split bar
down so that the
horizontal split bar
new projected six-month
operating income
is positioned as
shown in Figure 3– 80
to split the screen
horizontally.
original location
•
Use the scroll arrows
of vertical split box
in the lower-right
Figure 3 – 80
pane to view the total
operating income in column H in the lower-right pane.
150000
4%
15.75%
•
Enter
in cell B2,
in cell B3, and
in cell B8 (Figure 3 –80), which
causes the six-month operating income in cell H25 to increase from $2,567,592.65 to
$4,150,551.23.
To Goal Seek
If you know the result you want a formula to produce, you can use goal seeking to determine the value of
a cell on which the formula depends. The following steps close and reopen the Modern Music Shops Six-Month
Financial Projection workbook. They then use the Goal Seek command (Data tab | Data Tools group) to determine
the Support, General, and Administrative percentage in cell B8 that will yield a six-month operating income of
$3,000,000.00 in cell H25, rather than the original $2,567,592.65.
ADVERTISEMENT
0 votes
Related Articles
Related forms


Related Categories
Parent category: Education