What-If Analysis, Charting, And Working With Large Worksheets Page 86
ADVERTISEMENT
 1
1 2
2 3
3 4
4 5
5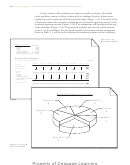 6
6 7
7 8
8 9
9 10
10 11
11 12
12 13
13 14
14 15
15 16
16 17
17 18
18 19
19 20
20 21
21 22
22 23
23 24
24 25
25 26
26 27
27 28
28 29
29 30
30 31
31 32
32 33
33 34
34 35
35 36
36 37
37 38
38 39
39 40
40 41
41 42
42 43
43 44
44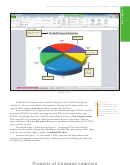 45
45 46
46 47
47 48
48 49
49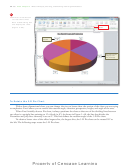 50
50 51
51 52
52 53
53 54
54 55
55 56
56 57
57 58
58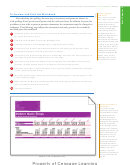 59
59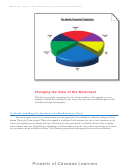 60
60 61
61 62
62 63
63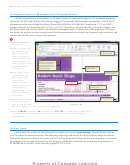 64
64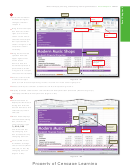 65
65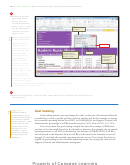 66
66 67
67 68
68 69
69 70
70 71
71 72
72 73
73 74
74 75
75 76
76 77
77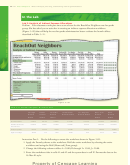 78
78 79
79 80
80 81
81 82
82 83
83 84
84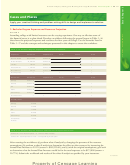 85
85 86
86 87
87EX 222
Excel Chapter 3
What-If Analysis, Charting, and Working with Large Worksheets
continued
Cases and Places
2: Fuel Cost Analysis
Personal
You are thinking about buying a new vehicle, and you want to make sure that you get the most fuel
savings you can fi nd. You know that there are hybrid vehicles available and so you decide to research
them as well as gas-only cars. Your friends also are interested in the results. Together, you decide
to research the fuel costs associated with various types of vehicles. Research the gas mileage for six
vehicles: three should run only on gas, and the others should be hybrid vehicles, combining gas and
battery power. After you fi nd the gas mileage for each vehicle, you will use formulas to calculate the
fuel cost for 1 month, 1 year, and three years. Assume that in a typical month, you will drive 400 miles
and that the average price of gas is $2.69 per gallon. Develop a worksheet following the general layout
in Table 3 –18 that shows the fuel cost analysis. Use the formulas listed in Table 3 –19 and the concepts
and techniques presented in this chapter to create the worksheet. Add a 3-D line chart showing the cost
comparisons as an embedded chart.
Table 3– 18 Fuel Cost Analysis
Vehicle
Miles Per Gallon
1 Month
1 Year
3 Year
Ford Expedition
17
Formula A
Formula B
Formula C
Dodge RAM 1500
20
---
---
---
Honda Civic
31
---
---
---
Chevy Silverado Hybrid
21
---
---
---
Ford Fusion Hybrid
41
---
---
---
Honda Civic Hybrid
45
---
---
---
Assumptions
Distance per Month
400
Price of Gas
$2.69
Table 3– 19 Fuel Cost Analysis Formulas
Formula A = (Distance per Month / Miles per Gallon)*Price of Gas
Formula B = ((Distance per Month / Miles per Gallon)*Price of Gas)*12
Formula C = ((Distance Per Month / Miles per Gallon)*Price of Gas)*36
3: Quarterly Income Projections
Professional
Notable Web Site Design is one of the largest Web site design and Web site hosting companies in the
Midwest. The company generates revenue from Web site design and selling Web site hosting space on
their Web servers. A fi xed percentage of the total net revenue is spent on administrative, equipment,
marketing, payroll, and production expenses. A bonus is expensed if the total net revenue for the
quarter exceeds $14,000,000. The company’s projected receipts and expenditures for the next four
quarters are shown in Table 3 –20.
With this data, you have been asked to prepare a worksheet similar to Figure 3–87 on page
EX 210 for the next management team meeting. The worksheet should show total net revenues, total
expenditures, and operating income for each quarterly period. Include a 3-D Pie chart on a separate
sheet that shows the quarterly income contributions to the annual operating income. Use the concepts
and techniques presented in this chapter to create and format the worksheet and chart.
ADVERTISEMENT
0 votes
Related Articles
Related forms


Related Categories
Parent category: Education